Advanced analytics have started to take over the game of hockey. From Corsi to expected goals, new ones are making their way into everyday hockey conversations when trying to best judge a team or player. For this article, we will be diving into that world to try and better explain some of the play from members of the Seattle Kraken. With all that said, here are five advanced analytic categories and which Kraken led the team.
Related: Hockey Advanced Analytics: What Are They & Why Are They Important?
Note: For the purpose of this exercise, stats will be used for players who played at least 15 games for the team and goaltenders who played at least six games. Statistics are based on five-on-five play only.
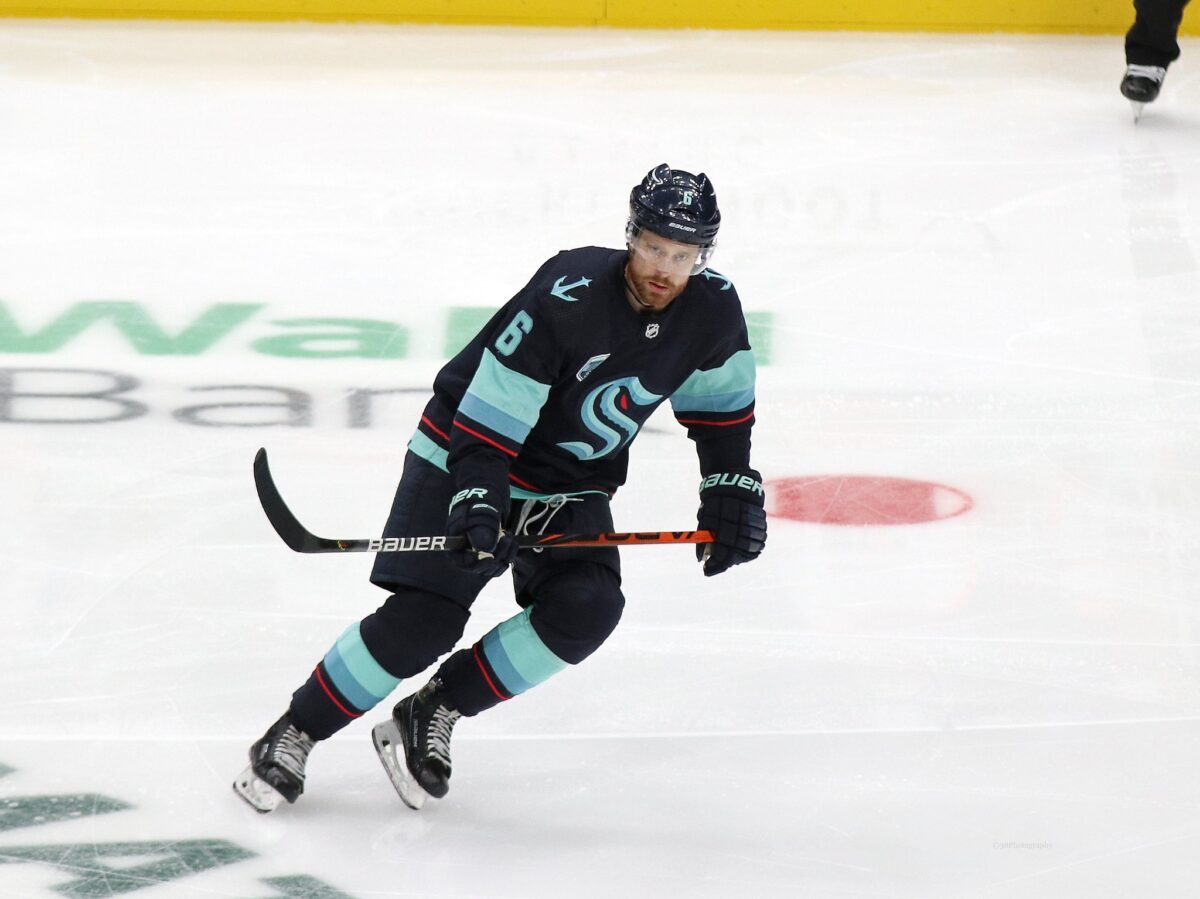
iCF- Adam Larsson
iCF or individual Corsi-for adds up a player’s shot attempts on the net and combines them into one solid number. This means any shot that hit the net, missed the net or was blocked counts towards this stat. While most may think a forward would have led in this category, it is defenceman Adam Larsson who had the highest iCF at five-on-five this season.
Why iCF is an important analytic is it shows which players are most active in the offensive zone when they have the puck on their stick. When it comes to Larsson, he attempted 244 shots this season at five-on-five. Of those 244, 109 hit the net, 53 were wide, and 82 were blocked. What this also says is that he needs to be more selective with his shot selection as less than 50% of the time, he hits the net.
Then you have Alexander Wennberg, who finished 15th on the team with 106 shot attempts. His breakdown was 69 hit the net, 14 missed and 23 were blocked. Looking at his iCF, it is clear he needs to shoot more, as 65% of his shots hit the net. This tells the reader that either he does not have the confidence to shoot the puck, or he is taking too much time to line up the perfect shot on the net. This analytic can help a coach get a better understanding of their player’s tendencies in the offensive zone, which is why it is a very useful tool to use.
IPP: Karson Kuhlman
IPP or Individual Point Percentage is determined by taking the total points a player accumulated divided by the total amount of goals scored while a player was on the ice. For example, if a player was on the ice for three goals and finished the game with one assist, their IPP would be 33.33%. This season for the Kraken, the team leader was Karson Kuhlman, who registered a point on seven of the eight goals he was on the ice for or 87.50%.
This statistic is important because it shows whether or not a player is a) contributing while on the ice and b) whether the team can produce while they are on the ice. To explain this, let’s look at Jamie Oleksiak. This season, the big defenceman finished with 14 five-on-five points. His IPP, however, was near the bottom of the team at 27.45%. What this tells the reader is that while the team creates offence when he is on the ice (51 goals), he is not involved in the play most of the time. Using this in a game situation, an opposing coach could look at this statistic and say when he is on the ice; he is not a threat to create offence.
Related: 2021-22 Kraken Report Cards: Geekie, Kuhlman, Oleksiak
On the opposite end, when it comes to Kuhlman, the analytic says the Kraken only score when he is on the ice if he gets a point on the play. This could lead to a coach creating a game plan to get a player the puck more as the odds are a goal comes if he touches the puck. While this statistic isn’t an exact science, it does help show how engaged a player is when it comes to goal scoring and which players are more bystanders in scoring plays.
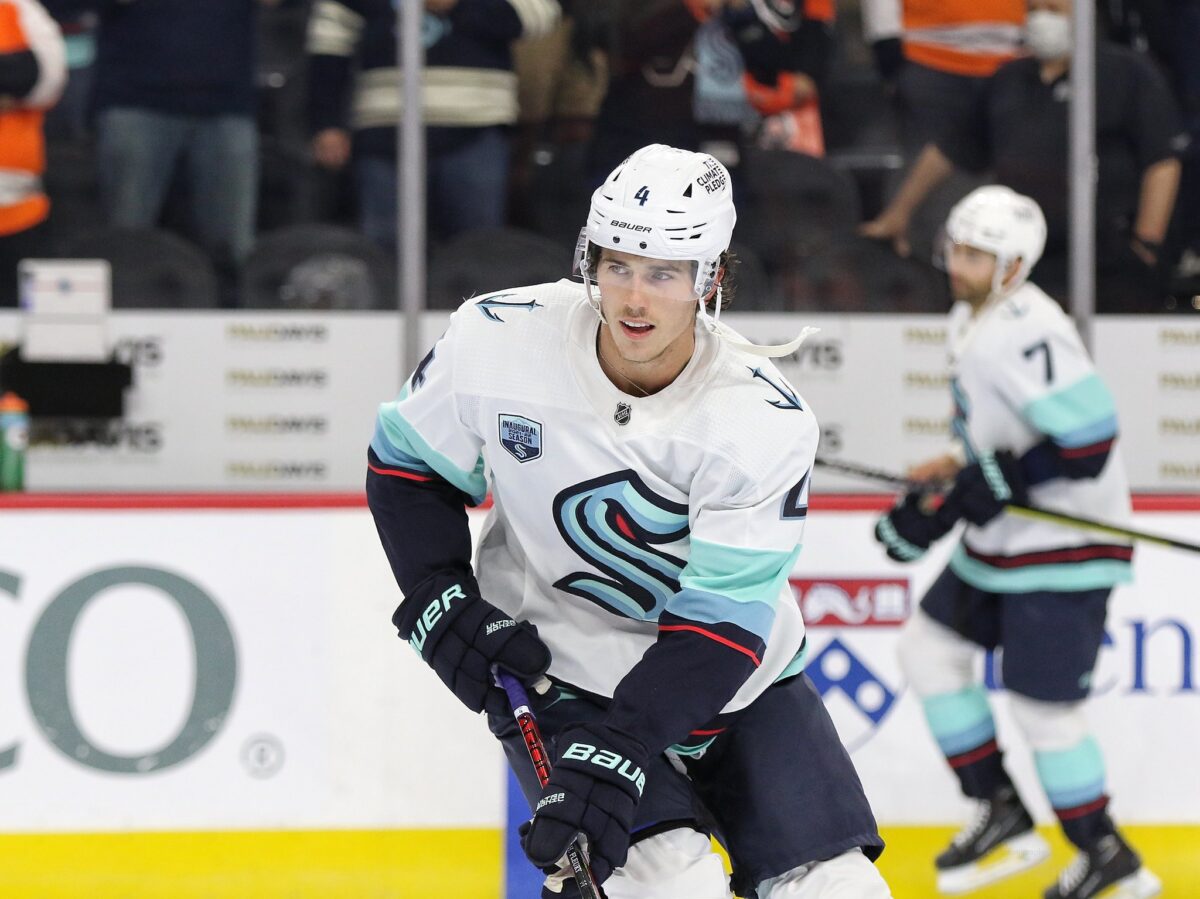
PDO- Haydn Fleury
PDO (Percentage Driven Outcomes) or SPSV% is a combination of the on-ice shooting percentage and the on-ice save percentage while a certain player is on the ice. In simple terms, when a player is on the ice, at what rate does the team score, plus what is the goaltender’s save percentage. The team leader based on the criteria this year was Haydn Fleury. His PDO of .9999 was made up of the team’s on-ice shooting percentage (7.53%) plus its on-ice save percentage (92.40%).
Now that everyone is most likely confused, here is why this analytic is important. Simply put, it helps determine how lucky a player is. Fleury is a perfect example of this as he finished with just four points, yet led the team in this category. The reason is, that despite the Kraken having some of the worst goaltending in the league (89.99%) when he was on the ice, they played well above average. This made up for the fact that the Kraken had a shooting percentage below the team average (8.07%) when he was on the ice.
The analytic can also be used to say that Jaden Schwartz was unlucky when he was on the ice. Not only was the on-ice shooting percentage below the team average (7.85%), the goaltenders performed below average when he was on the ice (87.50%). His PDO of 87.50% shows not only could the team not score, but the goaltenders had trouble making saves. Although this is a complicated statistic, it is useful when trying to determine if a player is producing or is just plain lucky within a respective campaign.
Goals Saved Above Expected: Chris Driedger
Goals saved above expected is difficult to determine as it relies on historical data and predictions. Unlike save percentage, which is a simple calculation of goals allowed divided by saves, this analytic relies on historical data to determine if a goaltender should have made the save compared to if they did. Essentially, did a goaltender allow too many bad goals, or did they bail out their team?
Of the Kraken’s three goaltenders, Chris Driedger was the runaway leader with 6.4 saved goals above expected. In 27 games, he gave up a total of 47 goals but based on historical data of where and how goals were typically scored; he should have given up 53.44. This means that at five-on-five, he was able to make up for his teammates’ mistakes and keep his team in games or at least keep the score lower.
Related: Kraken Have 3 Good Targets If They Decide to Move Driedger
On the reverse side, you have Kraken goaltender Philipp Grubauer who finished with the worst goals saved above expected in the league at five-on-five. In 55 games, he was projected to allow 98 goals. Instead, he allowed 125 or 27 more than what he should have. This analytic shows why the Kraken struggled this season and how with Driedger out long term, it is imperative they find a stable backup next season, as Daccord finished the season allowing 5.9 extra goals in his five games.
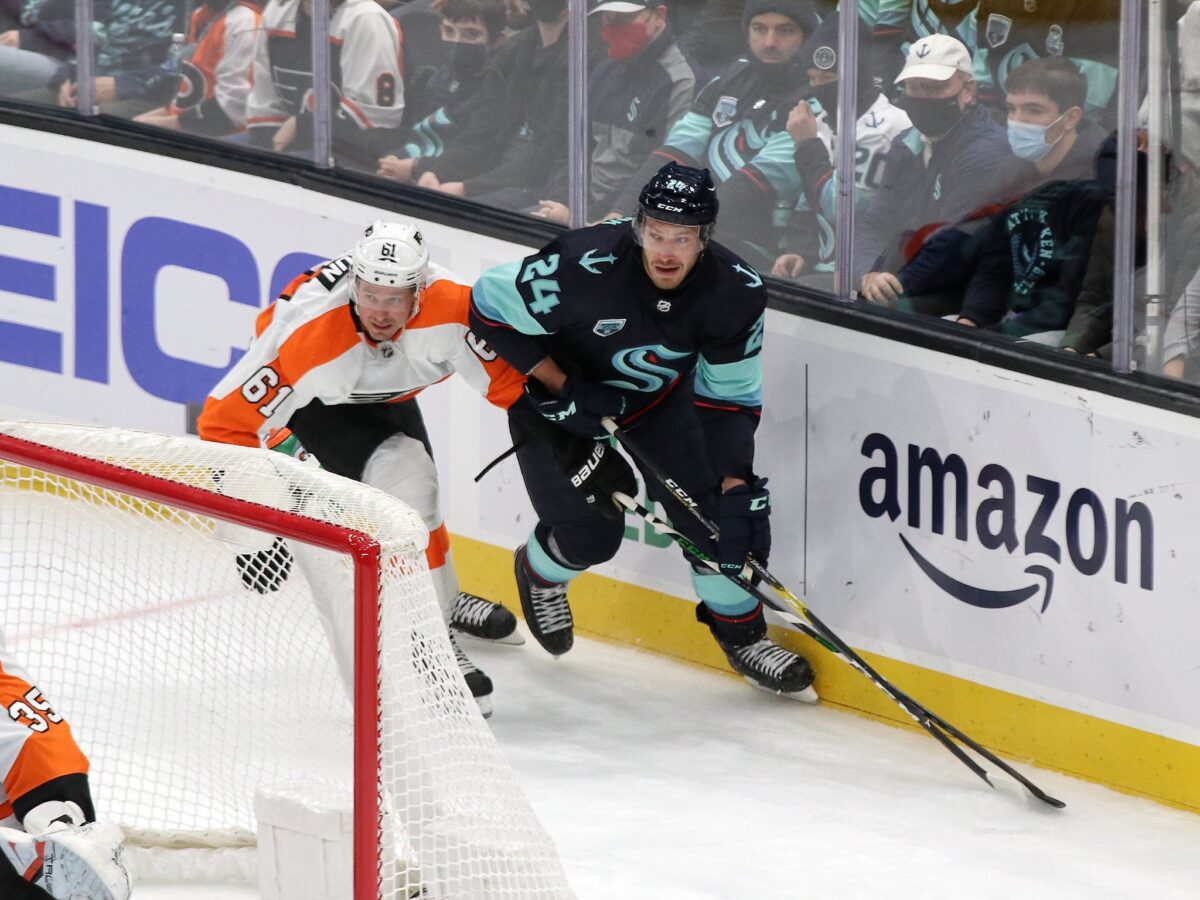
WAR- Jamie Oleksiak
WAR stands for wins above replacement which is a converted baseball statistic designed to determine how much value a player brings to a team. Basically, when you add up all the statistics of one player, do they provide more or less value than an average player would playing the same minutes.
In 2021-22, no player had a higher WAR on the team than Oleksiak. Overall, he finished the season with a 1.8 WAR which ranked him in a tie for 108th across the league. Based on his contributions, no player provided more overall value to the Kraken than the big defenceman. He provided some offence, was strong defensively and most importantly, provided the team value on a nightly basis.
One name that was surprising to see near the bottom was Larsson. Overall, he had a WAR of minus-0.3, meaning that the Kraken would have had slightly better results if replaced by a replacement-level player. This stat is not perfect but it shows how sometimes, single analytics aren’t enough to help determine a player’s true worth.
Analytics Help Make Teams Better
Although they may seem complex, analytics are crucial to building a successful team. While trying to acquire a high-priced free agent like Josh Manson (minus-0.3 WAR) would be nice, analytics would say you can get more value for cheaper by signing a player like Colin Miller (1.1 WAR). While some will argue analytics are a waste of time, they provide important information that helps teams improve.
Statistics provided by Natural Stat Trick, MoneyPuck and Evolving-Hockey