Over the weekend, the Detroit Red Wings parted ways with coach Jeff Blashill. Not enough was accomplished during the 2021-22 season to warrant bringing back Blashill for another season.
That said, the Red Wings are a better team than a year ago. Digging into the data can help us determine how much the team has improved since last season and why that wasn’t enough to save Blashill’s job.
2020-21 Red Wings vs. 2021-22 Red Wings
We’ll compare the two Red Wings squads using a few Key Performance Indicators (KPIs). And while there were surely developmental and moral victories along the way, these metrics can show us just how much things have changed in a year.
| Metric | 2020-21 Red Wings | 2021-22 Red Wings | Net Difference |
| Points % | 0.429 | 0.451 | 5.13% |
| GF/GP | 2.23 | 2.77 | 24.22% |
| GA/GP | 3.00 | 3.78 | 26.00% |
| PP% | 11.4% | 16.3% | 42.98% |
| SH% | 78.7% | 73.8% | -6.23% |
Right away, Detroit’s offensive numbers jump out. After two-plus years of futility on offense, the Red Wings finally figured out how to score under assistant coach Alex Tanguay.
But with that step forward, there was a step back when you consider the Red Wings’ defensive performance this season – 3.78 goals per game is a lot to give up on average over the course of the year. Even with an improved defensive corps, this is not the direction you want to be heading.
Overall, the scales tip ever so slightly in the direction of progress. The 5.13 percent increase in points percentage was nice to see, as was the improved offense. That said, the defensive shortcomings are clear and the reason why assistant coach Doug Houda was not retained.
Red Wings Offense: Year-Over-Year Comparison
We’ll start with the good news: Detroit’s offense improved year-over-year. Let’s dig a bit deeper on the Red Wings’ offensive numbers and measure their growth more granularly.
| Metric | 2020-21 Red Wings | 2021-22 Red Wings | Net Difference |
| CF/60 | 46.31 | 49.81 | 7.56% |
| GF/60 | 1.91 | 2.38 | 24.61% |
| xGF/60 | 1.95 | 2.34 | 20.00% |
| HDCF/60 | 8.57 | 10.26 | 19.72% |
All statistics at five-on-five. Metric definitions are provided below.
The ~25 percent growth in GF/60 is encouraging to see. The Red Wings still aren’t in the top-half of the league in scoring, but they’ve clearly become more dangerous offensively compared to last year.
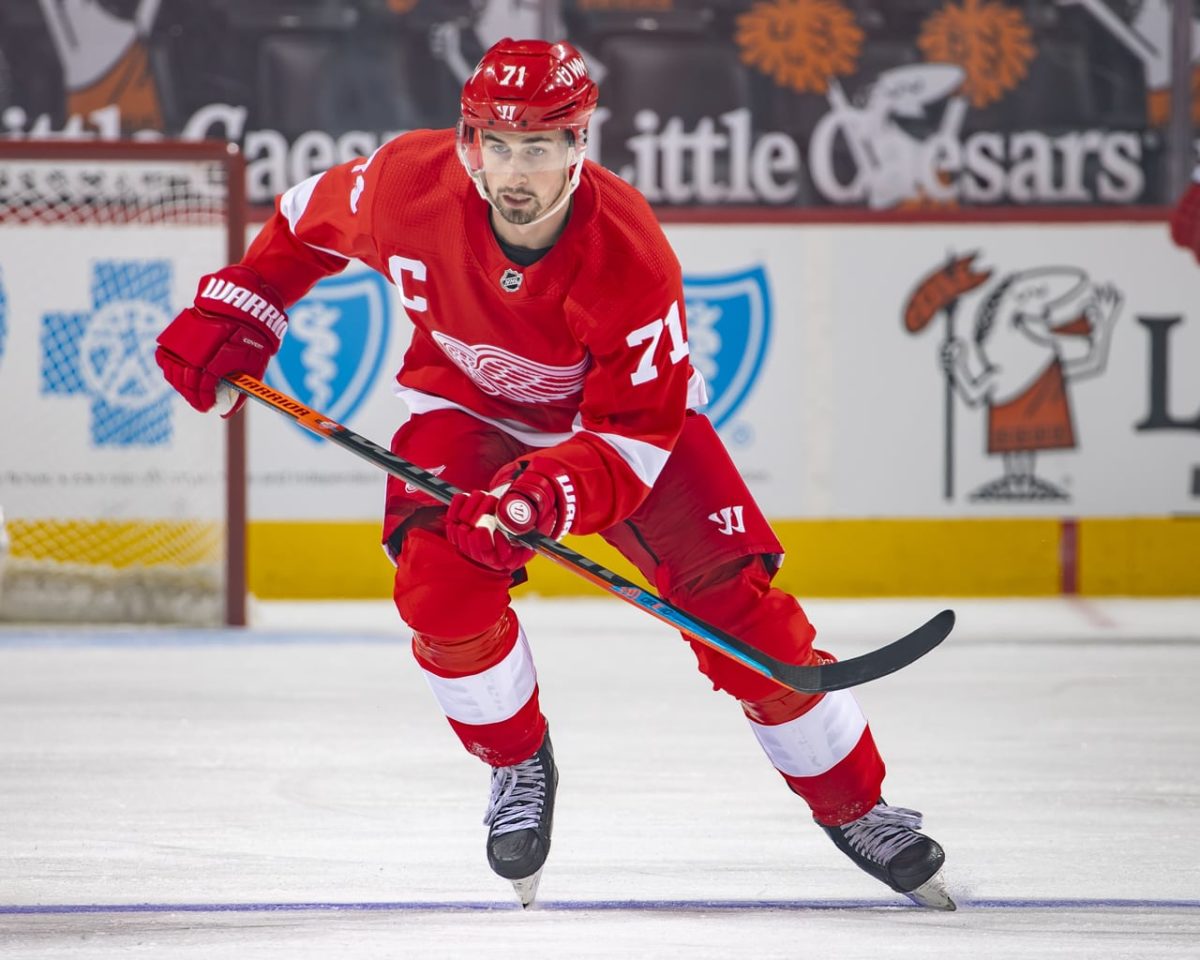
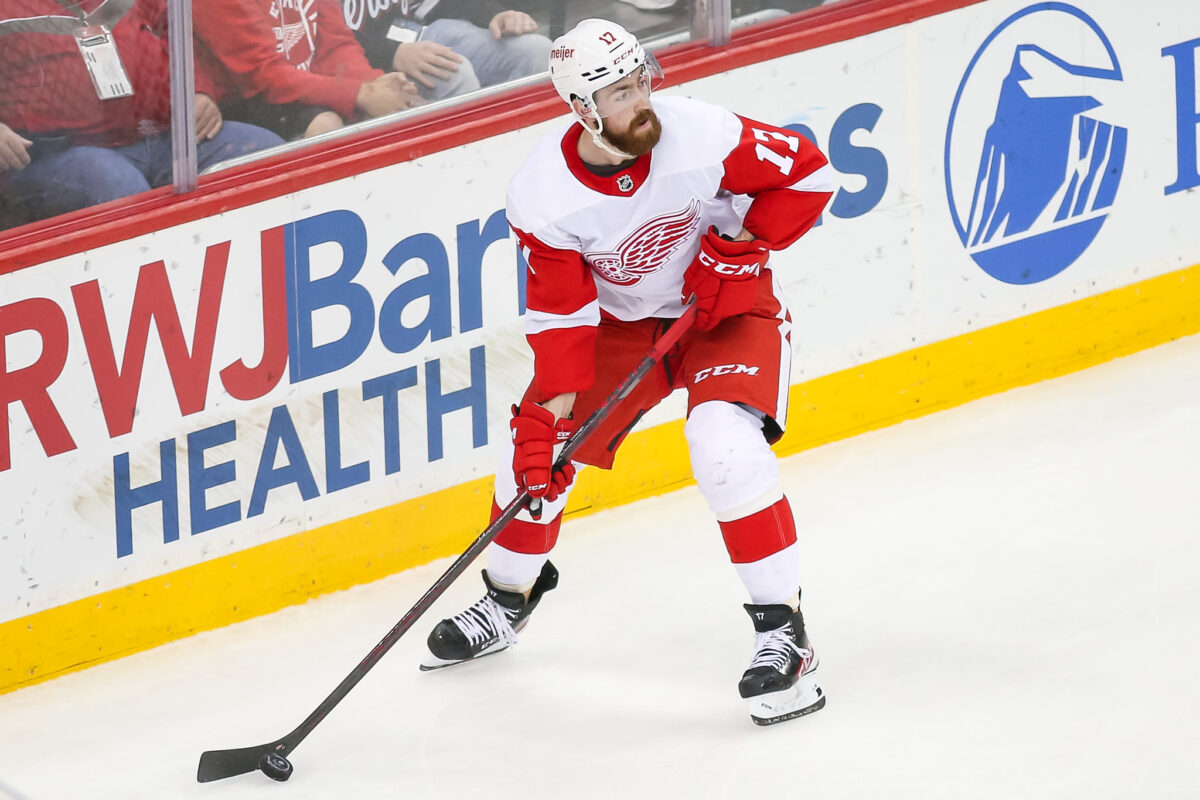
A large portion of the improved offense can be credited to breakout years from Dylan Larkin and Tyler Bertuzzi plus the arrivals of Lucas Raymond and Moritz Seider. Larkin, Bertuzzi, and Raymond combined for 84 goals – 37 percent of Detroit’s total goals.
What’s wild about the improved production is that the Red Wings were without their most lethal goal scorer for most of the season. Jakub Vrana only suited up for 26 games (and still managed to score 13 goals). Imagine if he was in the lineup throughout the entire season.
It should be noted that goal scoring is up across the league, so take this improvement with a grain of salt. Detroit’s offensive output still ranked toward the bottom of the league – 25th in all-situations goals per game and 24th in expected goals per game.
That said, I do want to highlight the 19.72 percent increase in HDCF/60. This shows that the Red Wings are getting to the dirty areas and making plays. This is independent from the inflation that’s impacting scoring around the league – the Red Wings are learning to generate better chances. That’s a win, and may be (at least part of) the reason Tanguay kept his job.
On that note, here are the top five Red Wings in terms of five-on-five HDCF relative to the rest of the team (HDCF/60 Rel):
- Dylan Larkin – 3.10
- Filip Zadina – 1.84
- Lucas Raymond – 1.71
- Tyler Bertuzzi – 1.49
- Filip Hronek – 1.29
Now, onto team defense.
Red Wings Defense: Year-Over-Year Comparison
Like we did with Detroit’s offense, we’ll do a deeper dive on the defensive side. Fair warning, it’s going to get ugly.
| Metric | 2020-21 Red Wings | 2021-22 Red Wings | Net Difference |
| CA/60 | 55.60 | 58.16 | 4.60% |
| GA/60 | 2.46 | 3.04 | 23.58% |
| xGA/60 | 2.33 | 2.71 | 16.31% |
| HDCA/60 | 9.95 | 13.19 | 32.56% |
All statistics at five-on-five. Metric definitions are provided below.
While the Red Wings’ year-over-year change for CA/60 isn’t terrible, the rest of the metrics are. Seeing a 23.58 percent increase in GA/60 and a 16.31 percent increase in xGA/60 is cause for concern, as are the additional high-danger chances allowed.
Clearly, the Red Wings took a step back defensively. It isn’t just the goalies or the defensemen at fault here. It’s the entire team.
You can’t blame a lack of talent – Detroit’s 2021-22 roster was easily more talented than the 2020-21 group.
What you have here is data confirming the eye test: the Red Wings lacked strategy and discipline in their defensive approach. At varying points throughout the season, the team looked lost defensively, and unable to course-correct.
If you give up seven goals in a game, something is wrong. That’s not an NHL goalie having a bad day – that’s a team not playing as a unit. Giving up 8, 9, 10, and 11(!) goals is further proof that there’s a disconnect between the players individually and with the coaching staff.
We’ll close this section out with an observation. Below are Detroit’s bottom-five and top-five players in terms of relative CA/60 (minimum 200 minutes played):
Worst CA/60 Rel:
- Oskar Sundqvist: 5.50
- Mitchell Stephens: 5.00
- Danny DeKeyser: 3.09
- Jake Walman: 2.84
- Adam Erne: 2.80
Best CA/60 Rel:
- Troy Stecher: -3.99
- Vladislav Namestnikov: -3.31
- Carter Rowney: -2.95
- Joe Veleno: -2.36
- Sam Gagner: -1.93
You can partially explain Detroit’s late-season collapse by looking at these rankings. The Red Wings essentially swapped out their three best defensive players (with respect to CA/60 Rel) for three players who would go on to have the worst CA/60 Rel numbers on the team. There’s more to it than just that, but it does offer some context for Detroit’s post-trade deadline woes.
Related: Will Red Wings’ Draft Lottery Luck Finally Change?
Assessment of the 2021-22 Red Wings
After analyzing the changes to Detroit’s offensive and defensive output, the two sides of the game essentially net out, signaling that the Red Wings plateaued this season. That is not what you want as a rebuilding team, and likely the reason why Blashill is no longer the coach.
Still, there’s momentum in Hockeytown. Let’s hope this season’s slow down is only temporary and that the organization continues to push forward toward a playoff berth in the near future.
Advanced Metrics Definitions
Below are quick definitions of the metrics used to quantify Detroit’s on-ice efforts:
- CF/60 & CA/60 – Corsi-for/against per 60. Shots on net, missed shots, and blocked shots per 60 minutes of five-on-five play.
- GF/60 & GA/60 – Goals-for/against per 60.
- xGF/60 & xGA/60 – Expected goals-for/against per 60 – according to Natural Stat Trick’s shot location model.
- HDCF/60 & HDCA/60 – High-danger chances for/against per 60 – per Natural Stat Trick’s shot location data.
Stats courtesy of NHL.com and Natural Stat Trick.