After starting the regular season a perfect 25 for 25 on the penalty kill, the Detroit Red Wings have slowed down, allowing 12 powerplay goals on their next 61 penalty kills (80.3%). The penalty kill has been even more noticeable recently as the Wings have allowed at least one powerplay goal in each of their past four games despite facing only one top-10 powerplay in that stretch. There haven’t been any significant injuries to the guys that play on the penalty kill, and only Joakim Andersson has been taken out of the lineup to make room for Pavel Datsyuk. Despite their recent slide, the Wings still rank 4th at 86%, but that won’t continue if the Wings continue to give up powerplay goals at their current rate. This led me to examine if there is a particular reason why the Wings penalty kill is suffering and if we can expect it to rebound.
Too Many Shot Attempts
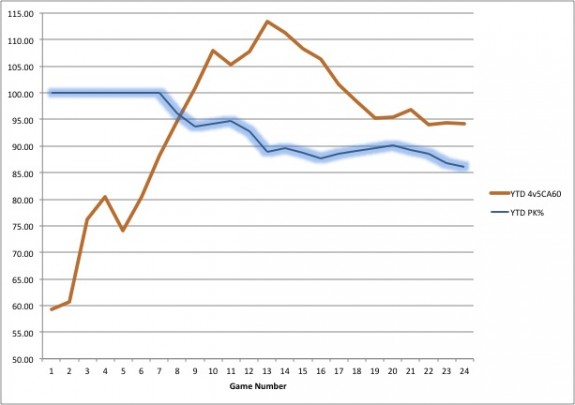
Here you’ll see a graph depicting the Year-To-Date shorthanded Corsi Against per 60 minutes for the Wings in addition to their Year-To-Date Penalty Kill% .
From this you can see that when the Wings’ penalty kill was clicking at 100%, they were holding opponents to an absurdly low amount of shot attempts against. The league average right for shorthanded CA60 right now is 97.81. In their first seven games when the penalty kill was perfect, the Wings had a shorthanded CA60 of 88.2. In the 17 games since, the shorthanded CA60 jumps up to 96.51. You can see from this graph that over the past four games, the average has been hovering right around 95. While the increased shot attempts certainly explains a portion of why the penalty kill has been shakier, the difference is not drastic enough to be the only explanation.
Unsustainable Goaltender Save Percentage%
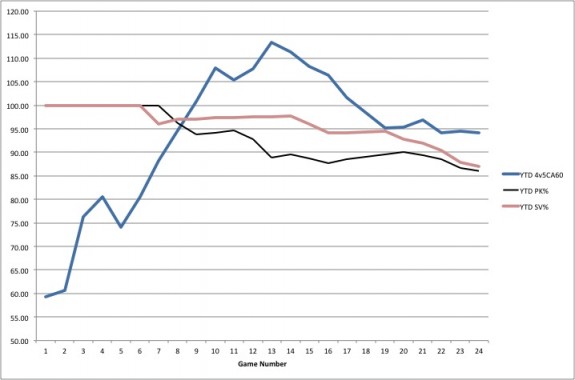
In addition to the Wings limiting shots, the team as a whole is getting outstanding goaltending while shorthanded. In Jimmy Howard’s first 15 games this season, he stopped 38 of the 40 shots he faced on the penalty kill, an outstanding 95% save percentage. For the season, Howard is at 91.0%, a sparkling number. Check out this graph of the Wings’ goaltenders’ year-to-date shorthanded save percentage.
From this graph you can see how the save percentage (pink line) has slowly declined this season in conjunction with the increased Corsi attempts (blue line). Both have resulted in the drop in penalty kill percentage (black line). Can Howard continue to post his 91.0% SV%? Prior to this season, Jimmy Howard held a career shorthanded save percentage of 87.5%. Howard is performing well above his career average. If you just look at Howard’s past three seasons, his shorthanded save percentage was just 86.1%. When you compare how he’s performing this season to his past three seasons, you can see why the Wings penalty kill has been much better this year.
Penalty Kill Moving Forward
From this data, I think we can make two conclusions about the Red Wings’ penalty kill this season. First, the penalty kill benefited from significant shot suppression in the early part of the season, but as the shot attempts against have increased, the penalty kill has faltered. Second, the Wings’ PK also benefited from their goaltenders posting an unsustainable save percentage in shorthanded situations. If Jimmy Howard were able to sustain the 95% shorthanded save percentage he owned just 10 days ago, that mark would be tied for the 2nd best mark since 2008, tied with 2013-2014 Cory Schneider, and trailing only 2009-2010 Michael Leighton. Essentially, the penalty kill was operating at unsustainable levels of shot suppression and save percentage and was due for a hefty regression which we are seeing now. The burning question will be just how much the penalty kill percentage drops.
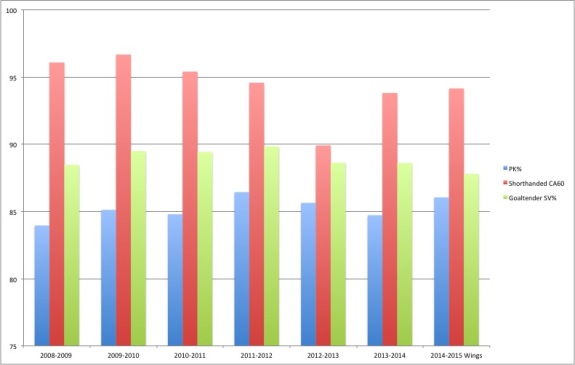
In looking at the top 10 penalty killing teams for each season since 2008, here are their shorthanded CA60 and their goaltenders’ shorthanded save percentage. I’ve averaged the PK%, Shorthanded CA60, and Goaltender SV% of the top-10 penalty killing teams for each season.
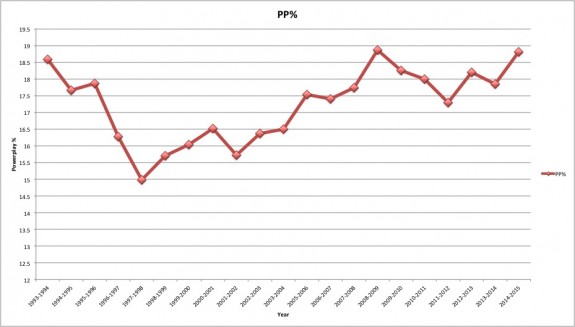
From this you can see that the Wings are performing right now on par with your average top-10 penalty killing team from the past six years. However, this has required Howard to play well above his career average and for the Wings to limit their shorthanded CA60 at an incredible rate. The other thing to consider is that the powerplays in the NHL are operating at a phenomenal percentage. The Pittsburgh Penguins lead the NHL with a 31.6% conversion rate. No team has topped 30% for a season since 1978-1979 when the New York Islanders operated at a 31.2% rate. The NHL record is 31.9% held by the 1977-1978 Montreal Canadiens. In addition to the Penguins operating at a historic clip, the league average for PP% is also dramatically up. Take a look at this graph showing the average PP% over the last 20 years.
As you can see, the league average of 18.81% this season is the 2nd highest mark since 1992-1993, with only the league average of 18.86% in 2008-2009 topping this season. The NHL implemented new rule changes this season that allow for more faceoffs to stay in the offensive zone during powerplays which may be factoring in to this increased conversion rate. Regardless of the cause, it will be tough to sustain success each night facing powerplays that are converting every once every five or six chances. If I had to guess, I’d say that the recent trend on the penalty kill will become more of a norm, as it’s going to be tough for the Jimmy Howard and the Wings to continue to perform at above career average levels.
All data from War-On-Ice and Hockey-Reference
