Teams competing in the National Hockey League are amongst the fiercest professional sports teams in the world and any hockey fan can tell you why. It’s fun, it’s fast and it involves a particular intelligence developed with experience. Every team in the league executes a strategy and every player follows a system; an efficient game plan includes different tactics to combat the opposition. Of course, no team is perfect across the board and at some point, their weak spot will reveal itself.
For the Philadelphia Flyers, their weak spot is being in five-on-five situations.
http://gty.im/622553978
That’s a pretty bad weak spot to have. Currently ranking first for most goals against by even strength, the Flyers have a tough road ahead of them. One of the best ways to combat this particular weakness, though, is to master those non-five-on-five situations. Trailing not too far behind the No. 1 ranking team for best power-play percentage, the Columbus Blue Jackets, the Flyers have taken full advantage of the one- and two-man disadvantage their opponents incur oh so often.
Power-play percentage essentially represents the number of power-play opportunities a team will score a goal on and this is one of the Flyers’ most effective offensive weapons their system has to offer.
Interestingly, the Blue Jackets and Flyers are both recipients of two of the top three defensemen drafted at the 2015 Draft. Columbus took Zach Werenski at No. 8, while Philadelphia took Ivan Provorov at No. 7, both of which debuted the NHL this season.
Werenski is taking the breath away from pretty much everyone and currently ranks sixth for most points by NHL defensemen. Provorov isn’t like Werenski in that sense, but that doesn’t mean he won’t develop into one of the NHL’s offensive-defender elitists, just like a No. 7 is projected to.
When it comes to Provorov, the biggest question fans have regarding his development is how long it will take for him to turn into the elite defensemen they know he can be.
Riddled with inconsistencies, the Russian defender still has a long way to go before he starts making a big impact on the team. But I also have good news. Provorov’s development is heading in the right direction. Just like many other rookies in the NHL, his development has a strong correlation to his time on ice (TOI).
The Provorov Progress Report
Of all the NHL’s current rookies, Provorov probably has one of the clearest patterns in performance when comparing ice time. It’s been incredibly consistent since starting the 2016-17 season, playing an average of 20:03 per game in October and now playing an average of 20:25 per game in November. He’s also making more hits, takeaways and blocked shots per minute played.

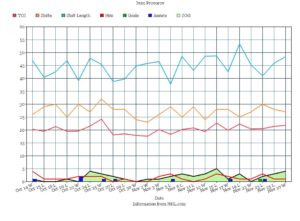
Provorov has registered points in a total of seven games to date. Of these seven games, five were games in which his shift length dipped and shifts became more frequent. In these five games, points weren’t the only thing to be expected. The graph above shows his hits became parallel to his shots on goal during these “short but sweet” periods. This could indicate that his events occur more often when shifts are shorter in length and more frequent.
So let’s find out.
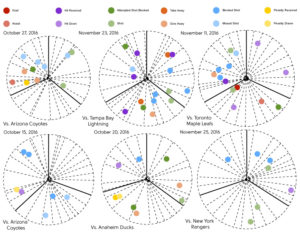
 In the pie graphs above, we have Provorov’s on-ice events charted from six different games. The size of each pie represents the minutes Provorov played that game in comparison to each other. The bolded “slices” of each pie represent the first, second and third periods and their size reflects the TOI Provorov played that period. Within each bolded slice are smaller slices which represent Provorov’s shifts that period and their size reflects the length of shift. The dots inside each pie graph represents an event by Provorov and their color indicates the event type.
The three games in the top row are games Provorov had shorter, more frequent shifts in and the three games in the bottom row are games he had fewer, longer shifts in. Clearly, more events occurred in top-row games. You’ll also notice that in the first period of his Nov. 11 game against the Toronto Maple Leafs, he only incurred two events, both of which were hits received. Here, his shifts were relatively similar in length throughout the whole period. Furthermore, when you look at shifts in the third period of his Nov. 25 game against the New York Rangers, his shifts were also very similar in length as well. Perhaps, lengthy shifts can explain the reason he only incurred one event that period.
Flyers Improving With Short Shifts

In October, Provorov’s average shift length was 43:14 but in November, it decreased to 28:06. This is great news for Provorov because he’s clearly able to do more when shifts are shorter, even if his TOI remains the same. His shots on goal per minute played increased to once every 8:50 in November, from 16:43 in October. His blocked shots per minute played increased to every 12:04 in November, from 15:25 in October. As mentioned earlier, his hits and takeaways per minute played also increased in November, while his giveaways remained the exact same.
Ron Hextall, the Flyers’ general manager, has given Provorov a public pat on the back for his services rendered thus far.
Expectedly, he acknowledged Provorov’s inconsistencies but it seems that Hextall also acknowledged an optimal balance of TOI for the 19-year-old. By decreasing Provorov’s average shift length, the coaching staff is putting him in ideal situations. However, giving Provorov shorter shifts more often isn’t ideal for the team, especially if his TOI remains the same because he wouldn’t be paired with the same defenseman each shift and that could potentially lead to increased penalties for teammates.
Regardless, that isn’t the issue and it may never be. Provorov’s development might be slow, but a lot of the league’s best defensemen started off that way too. Eventually, the Flyers will have a defensive and puck-possessive force not to be reckoned with and it looks like they’ve identified the best way to help Provorov get there.