Compared to previous seasons, the Detroit Red Wings have been giving up a lot of goals. But who is to blame for the increase in goals against – the goalies, or the team in front of them?
The goal of assigning blame isn’t to harp on a deficiency, but rather to identify which aspect of Detroit’s game needs adjusting. Practice makes perfect and knowing what exactly needs to be worked on—goaltending or team defense—will lead to better results.

To answer the question of Detroit’s blame game, there are a few factors to be considered. First, how are opponents generating their scoring chances? Also, where are the shots coming from? Is the team giving up too many high-danger chances? And finally, could the goalies have prevented the goals against?
Related: Are the Red Wings Progressing?
Let’s take a look at how the Red Wings have fared in these on-ice factors so far this season.
How Are the Scoring Opportunities Being Created?
Metrics: Scoring chance share (organically created offense vs. Red Wings turnover), game state (5v5, 4v5, 5v4, 6v5, etc).
Since there have been a few ugly stretches so far this season, we’re going to focus on the last ten games when evaluating scoring chance share. During this span, the Red Wings gave up 3.10 goals per game – an improvement over their season-long average (3.81). But how were these goals generated?
- Organic offense: 20
- Red Wings turnover: 11
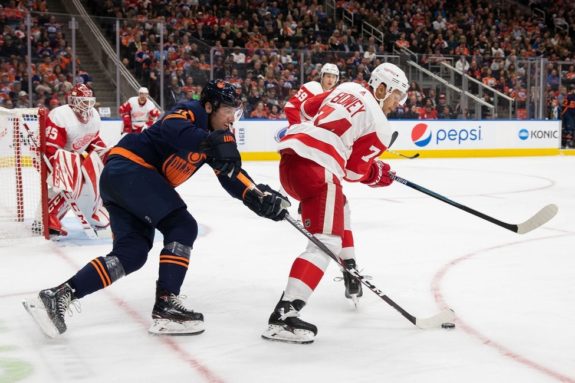
Even without a benchmark to compare against, that’s a lot of goals stemming from Red Wings’ turnovers. Turnovers lead to scrambling and spotty defensive zone coverage – or even breakaways.

Of the 31 goals against, 20 came at five-on-five. That’s two goals allowed at even-strength per game – during a stretch of improved hockey. Not good.
In addition, six more goals came on the penalty kill and another three with an extra attacker during a delayed penalty call. Nine total goals down a man is a lot over a ten-game stretch, but is not surprising to see considering Detroit’s penalty kill ranks 30th in the NHL.
Related: Red Wings Better Off at Rock Bottom?
Where Are the Shots Coming From?
Metrics: Shot location (high-, medium-, and low-danger), shot location save percentage.
What kind of shots are the Red Wings giving up? Let’s take a look at Natural Stat Trick’s five-on-five shots against per 60 calculations for high-danger (HDSA), medium-danger (MDSA), and low-danger shots against (LDSA) and compare Detroit’s goalies’ workload against that of Tuukka Rask. Why Boston’s stellar netminder? Because he’s been outstanding for the Atlantic Division-leading Bruins and, in this case, we’re comparing current state with ideal state.
| Goalie | HDSA/60 | MDSA/60 | LDSA/60 |
| Jimmy Howard | 6.96 | 10.10 | 16.06 |
| Jonathan Bernier | 7.66 | 7.77 | 13.38 |
| Tuukka Rask | 6.19 | 7.31 | 12.83 |
The main difference between Detroit and Boston in terms of shot location is high-danger shots against. Compared to Rask, Jonathan Bernier has faced a shot and a half more per 60 from high-danger shooting areas. The Red Wings are also giving up more shots in general, which shouldn’t come as a surprise.
How have Jimmy Howard, Bernier, and Rask fared against these shots at five-on-five? Let’s take a look at their respective save percentages by zone.
| Goalie | HDSV% | MDSV% | LDSV% |
| Jimmy Howard | 0.750 | 0.902 | 0.954 |
| Jonathan Bernier | 0.829 | 0.912 | 0.965 |
| Tuukka Rask | 0.876 | 0.895 | 0.980 |
A couple things stand out here. First, Rask has a much better high-danger save percentage than Bernier, who has easily outperformed Howard facing similar shots. In addition, it’s surprising to see both of Detroit’s goalies fare better than Rask on medium-danger shots, though there’s not that much of a difference.
Overall, the takeaways here are that the Red Wings are giving up more high-danger shots against than the (Black and) Gold standard of the NHL and Detroit’s netminders have a lower save percentage on shots from that area. But can Bernier and Howard be faulted for having a more difficult workload? Perhaps the eye test could add some context.
Related: The Grind Line: Predicting the Red Wings’ Leading Scorer of the 2020s
Could the Goals Have Been Stopped?
Metrics: Mitch Korn goal categories, goals against (GA) vs. expected goals against (xGA).
While with the Washington Capitals, goalie coach Mitch Korn developed categories to classify goals: should have had, could have had, and no chance. Using these three goal categories, we can evaluate Detroit’s netminders based on the goals that they’ve allowed. Before digging in, here’s a quick explanation of the categories:
- Should have had – The puck should have been stopped.
- Could have had – If the goalie approached the shot differently, the goal could have been prevented.
- No chance – The goalie had zero chance to stop the puck (i.e. wide open shooter, perfectly placed tip, backdoor finish).
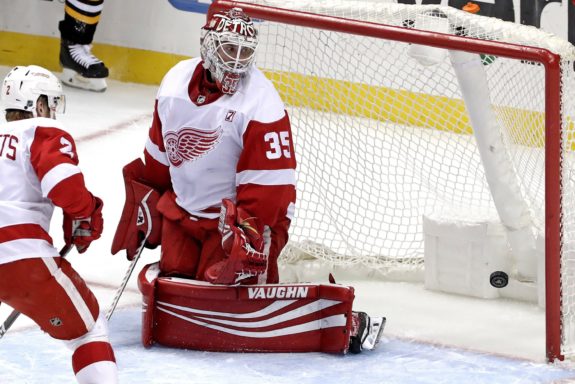
I evaluated the goals against over the past ten games and found that—for the most part—Detroit’s goaltenders have been doing their job.
| Goalie | GP | Should Have Had | Could Have Had | No Chance | Total |
| Jonathan Bernier | 6 | 2 | 3 | 6 | 11 |
| Eric Comrie | 1 | 1 | 1 | 2 | 4 |
| Jimmy Howard | 3 | 3 | 6 | 3 | 12 |
| Calvin Pickard | 1 | 1 | 1 | 2 | 4 |
| Red Wings Total | 10 | 8 (25.8%) | 11 (35.5%) | 13 (41.94%) | 31 |
There’s not much that can be done on the goaltenders’ part when over 40 percent of the goals going in are shots they have no business stopping. Bernier—in particular—has been sharp lately. Only two of the 11 goals allowed should have been stopped. Zero would be great, but that’s just not realistic.
So while Detroit’s goalies have stood their ground as of late, the season-long story is a little different.

When comparing actual goals against to expected goals against (xGA) over the course of the season, it’s not pretty for Howard. Per Evolving-Hockey’s model, he’s given up 17(!) more goals than the expected amount given the difficulty of shots he’s faced. That equates to about 1.15 goals against per 60 more than expected.
Bernier, on the other hand, has allowed close to the same amount that’s been expected. The netminder has given up five more goals that Evolving-Hockey expects, which is much more reasonable over the course of 23 games.
Verdict: Blame the Defense
While Detroit’s goalies aren’t completely innocent, Bernier and Howard have played better as of late. At this point in the season, it’s the defense that needs the most work. Opponents are just getting too many high-quality chances and the goalies can’t stop them all.
Given the talent Jeff Blashill is working with, it’s difficult to imagine serious improvement. But if the Red Wings could at least address bad habits before the end of the season, that growth will help next year’s team and beyond.
Stats courtesy of NHL.com, Natural Stat Trick, and Evolving-Hockey.