There are a number of significant similarities between the Columbus Blue Jackets playoff qualification round matchup against the Toronto Maple Leafs and last year’s first-round series against the Tampa Bay Lightning. And there are some very important differences, too.

Stop me if you’re heard this one before. No, wait, don’t stop me ‘cause you’re going to hear it again! Following the regular season, the Blue Jackets faced an opponent that outscored them by over 20% in the regular season. A team that was just as good on the road as it was at home.
That team had three (or more) players end the regular season with more points than the Blue Jackets’ top scorer. In addition, it had at least five players with a better plus/minus rating than any Blue Jacket.
Related: Darryl Sittler – Toronto Maple Leafs Legend
Flashback to the summer of 2019 and then look toward this summer. Last year it was the Lightning and this year it’s the Maple Leafs. The situations are not the same, of course. The Lightning won the Presidents’ Trophy for the best regular season (128 points), with a record-tying 62 wins, while Columbus snuck into the playoffs as the second wild card (98 points). On the other hand, this year Toronto and Columbus both ended the regular season with 81 points.

Last season, Tampa Bay led the Eastern Conference (and the NHL) with a power play that clicked at 28.2%. Columbus, on the other hand, finished 14th of the 16 Eastern Conference teams. The teams led the conference and league in penalty kill, tied at 85%. This year, Toronto’s power play ranked third in the Eastern Conference, with the Blue Jackets ranking third . . . from the bottom (14th of 16 teams). The Columbus penalty kill wasn’t nearly as dominant, with an 81.7% success rate (7th in the conference), but much better than Toronto’s 12th-ranked penalty kill (77.7%).
Both Columbus opponents played an up-tempo, high-speed offensive game during the regular season. Both teams boast some super-skilled forwards. But unlike last summer’s opponent, the Blue Jackets won’t be facing a goalie who finished top-10 in the league in both goals-against average and save percentage. In fact, both Columbus goalies ended the 2019-20 regular season with better numbers than the Maple Leafs starter and their backup goalie, acquired just weeks before The Pause that ended the regular season.
Comparisons Using Advanced Statistics
Over the past half-dozen years or so, hockey analysts and fans have been inundated with new ways to quantify and qualify our sport. Often called “advanced analytics” by proponents and “fancy stats” by detractors, an entire industry has grown up around the concept of “There has to be a better way to get detailed information about teams and players.” (For an explanation of the more common statistics-related abbreviations, check out LiveAbout.com.)
Related: Traditional Statistics vs. Advanced Analytics: Making Better Business Decisions
It’s not uncommon for an NHL team to employ one or more full-time analytics people. You’ll find dozens of sites online that present advanced statistics in a variety of ways (often using the same data, just presented in a different way). Perhaps the two most common advanced stats are “Corsi” and “Fenwick,” named after the guys who developed the stats. You’ll find an explanation of the procedures here.
Before I start throwing numbers at you, I should also let you know that some very well informed people are not big fans of advanced statistics. Andrew Wilson calls Corsi “overrated.” Tony Wolak wonders if the stats are “reliable.”
I’d love to tell you that I got out my desktop calculator, slide rule, and abacus, watched video of all of the games played last season, and did my own fancy stats. But why should I when so many other have already done the work for me?
After looking at dozens of websites and consulting with colleagues and other experts, I’ve elected to present comparisons based on a couple of reliable sites that compile various stats, rather than using individual sites for each set of numbers.
Maple Leafs vs. Blue Jackets Using Analytics
The website NaturalStatTrick.com has a wealth of information. Corsi, Fenwick, and a number of other statistics are available, such as “Scoring Chance Shots,” High Danger Chances,” “Low Danger Scoring,” and the mundane “Shots” and “Goals.” And you can see the stats based on such variables as “5v5” or “Power Play” or even “Against Empty Net.”
Because of space limitations, I’m going to intentionally fall into the trap that critics of advanced stats warn about. I’m going to “simplify” things and only present a few statistics that best illustrate the differences between the teams’ offensive capabilities. Click on the link for NaturalStatTrick above if you desire to dig deeper. Tip: Before you start diving into all these stats, grab a bag of breadcrumbs or a long piece of string, so that you can find your way out again.
| Statistic (all strengths) | Toronto Maple Leafs | Columbus Blue Jackets |
| Corsi % | 51.57% | 49.23% |
| Fenwick % | 51.00% | 50.87% |
| Scoring Chance For/Against | 2149/1937 | 1756/1783 |
| Scoring Chances % | 52.59% | 49.62% |
| High Danger Shots For/Against | 620/596 | 512/481 |
| High Danger Goals For/Against | 132/122 | 92/83 |
| PDO | 1.004 | 0.992 |
As you can see, Corsi % (all shots toward goal) is substantially higher for Toronto – the Maple Leafs took more shots than their opponents. Fenwick % (all shots except those blocked) is almost even between the teams. Comparing these two stats tells us that, while Toronto outshot their opponents at a much higher rate than Columbus, the Blue Jackets had a lower percentage of their shots blocked.
Also significant, there were a lot more total scoring chances for both the Maple Leafs and their opponents than occurred in Blue Jackets games (4,086 to 3,539). And the Maple Leafs had more scoring chances than their opponents, but the Blue Jackets’ opponents had more scoring chances than Columbus.
Related: Hockey Analytics & Advanced Stats Can Take out the Guesswork
The so-called “High Danger” shots and goals generally refer to those in close to the goal and in the areas where gritty players get their opportunities. We’re not talking about a shot from the blue line that scores, but rather that shot from the blue line that gets tipped in by a player getting whacked and slashed in front of the goalie. Or the player taking a beating so that he can be in position to pounce on a rebound.

Both Toronto and Columbus outplayed their opponents in the high danger categories. While the raw numbers for the Maple Leafs are higher, both teams out played their opponents in these categories, and by rather similar percentages.
PDO is an interesting statistic that combines goals scored plus saves made. You’ll find a nice explanation and vote for it to be the statistic here.
The bottom line: this sampling of advanced statistics shows that the Maple Leafs played games that were much more active in terms of pucks toward and into nets. And, gosh golly, we can look at the “dinosaur” stats to back that up: Goals For (GF) + Goals Against (GA) = Total Goals. Toronto had 238 GF and 227 GA for a total of 465 goals during the regular season. Columbus had 180 GF and 187 GA for a total of 367 regular season goals in their games. 465 total goals vs. 367 total goals, yup, the old-fashioned statistic supports the advanced stats pretty well, doesn’t it?
Top Maple Leafs and Blue Jackets by Advanced Stats
It’s also telling to look at individual performers for each team to get a good sense of what style (and success) they had in the regular season. The following information comes from the Hockey Reference website.

I ranked the top players (who participated in at least half their teams’ games) according to a “fancy stat” that I just made up: the average of Corsi and Fenwick. The significance of this new statistic cannot be understated. (Yes, “understated,” not “overstated.”) It’s pretty much nothing special, other than it provides a simple way to rank these players. The cutoff is an average of 50% (even if a player was above 50% in one or the other category).
| Name | Team | Corsi % | Fenwick % | Average |
| Oliver Bjorkstrand | CBJ | 55.4 | 56.5 | 55.95 |
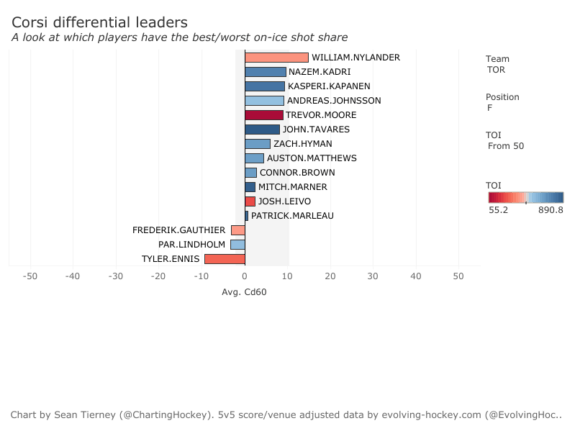
| William Nylander | TOR | 55.8 | 53.9 | 54.85 |
| Ilya Mikheyev | TOR | 54.6 | 54.2 | 54.40 |
| Eric Robinson | CBJ | 53.3 | 55.1 | 54.20 |
| Auston Matthews | TOR | 54.2 | 53.9 | 54.05 |
| Tyson Barrie | TOR | 54.2 | 52.3 | 53.25 |
| Jake Muzzin | TOR | 52.8 | 53.7 | 53.25 |
| Mitch Marner | TOR | 53.0 | 53.2 | 53.10 |
| John Tavares | TOR | 53.5 | 52.4 | 52.95 |
| Zach Hyman | TOR | 52.3 | 52.2 | 52.25 |
| Alexandre Texier | CBJ | 51.1 | 53.3 | 52.20 |
| Justin Holl | TOR | 51.5 | 52.5 | 52.00 |
| Pierre-Luc Dubois | CBJ | 51.2 | 52.4 | 51.80 |
| Alexander Kerfoot | TOR | 52.1 | 51.5 | 51.80 |
| Nick Foligno | CBJ | 50.0 | 52.4 | 51.20 |
| Kasperi Kapanen | TOR | 52.0 | 50.1 | 51.05 |
| Markus Nutivaara | CBJ | 50.2 | 51.1 | 50.65 |
| Jason Spezza | TOR | 51.5 | 49.8 | 50.65 |
| Pierre Engvall | TOR | 51.2 | 49.7 | 50.45 |
| Travis Dermott | TOR | 50.3 | 50.4 | 50.35 |
| Morgan Rielly | TOR | 51.4 | 49.3 | 50.35 |
| Rasmus Sandin | TOR | 52.5 | 48.1 | 50.30 |
| Zach Werenski | CBJ | 49.8 | 50.7 | 50.25 |
The first thing to note is that the table includes 16 Maple Leafs and only 7 Blue Jackets. That’s just about 70% of the list. (No, just because I used a percentage does not make it an advanced statistic.) Of the top 10, eight are Maple Leafs (80%). By this “statistic,” the Maple Leafs are a far more dynamic and shot-effective team.
Almost one-third (5 of 16) Maple Leafs on the list are defensemen. Of the seven Blue Jackets in the table, only two are defensemen, and they’re the last of the seven.

One other thing to note in the above table: 11 of 16 Toronto players had a higher Corsi % than their Fenwick %, while none of the Columbus players had a higher Corsi %. That would seem to indicate that the Blue Jackets on the list did a better job of making sure that their shots weren’t blocked.
The Corsi/Fenwick average shows that the Maple Leafs have a majority of the big shooters, but that’s not the whole story. Keep in mind that the Blue Jackets’ goalies Joonas Korpisalo and Elvis Merzlikins were statistically far superior to the Maple Leafs’ Frederik Andersen and late-season acquisition Jack Campbell:
- Merzlikins: 2.35 GAA (#5 in the NHL), .923 SV% (#5-T)
- Korpisalo: 2.60 GAA (#15), .911 SV% (#28)
- Campbell: 2.80 GAA (#34), .909 SV% (#31-T)
- Andersen: 2.85 GAA (#35), .904 (#41-T)
What Do the Numbers Tell Us?
Numbers don’t lie. However, the interpretation of those numbers can vary quite a bit. Someone else might look at these statistics and draw a totally different conclusion. For my two cents, the fact that the teams both ended the regular season with 81 points in the standings – but Toronto’s games had quite a bit more offense (both shots and goals) – tells me that these opponents play much different styles. The Maple Leafs shoot and score; the Blue Jackets keep the scoring down (for themselves and their opponents), playing a more defensive style.
Related: Top 5 Stanley Cup Playoff Upsets
During the upcoming best-of-five series, the overall style of play may vary from game to game. Some may have high scores, while others could be defensive battles. It might be a sweep by either team or the series could go five games. Odds are, though, whichever style prevails will lead to three wins and give us the series winner, the team that moves on to the Stanley Cup Playoffs.
My prediction is that the Columbus goaltending will outplay Toronto’s forwards, and coach John Tortorella’s Blue Jackets will be in the Stanley Cup Playoffs for the fourth year in a row.