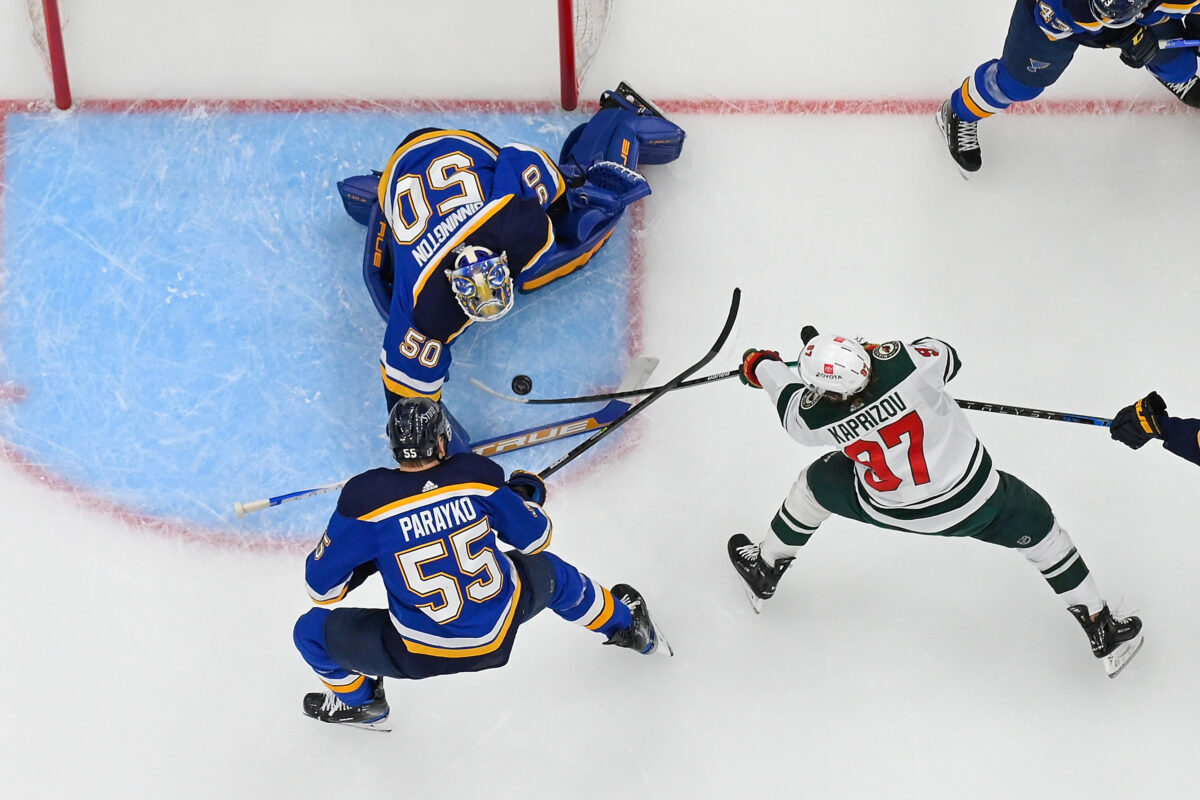
Analytics and advanced metrics are undoubtedly taking over the NHL. Each team has its own department dedicated to crunching the numbers and making spreadsheets to inform everything from personnel decisions to in-game adjustments.
These same analytics were not kind to the St. Louis Blues in 2021-22. The Athletic’s model, which uses these metrics to predict the outcomes of playoff series, gave the Blues a 25 percent chance to beat the Minnesota Wild in the first round of the Stanley Cup Playoffs. After falling down 2-1, they dominated the next four in a row, advancing to the second round to face the Colorado Avalanche.
While the Blues lost to the Avalanche in six, they were 4.3 seconds away from possibly forcing a seventh game, and it was easily the most competitive series Colorado faced en route to the Stanley Cup Final. It was also the only series the Avalanche had in the West that they did not sweep
That begs the question: what did these analytics get wrong about the Blues? How was the only Western Conference team to compete with Colorado so heavily predicted to be bounced in the first round?
Before that, I’m going to take a brief sidebar to talk broadly about what they mean before getting into how they affect the Blues. While this only scratches the surface, it’ll provide a necessary framework for understanding the case I’ll make later.

The most important stat to understand here is expected goals (xGoals) for/against. Simply put, these are a way to measure the quality of shots a team gets, since a point-blank shot is more likely to result in a goal from 130 feet away (looking at you, Mike Smith). This determines how many goals a team should be scoring or allowing based on the quality of shots that team is generating/giving up. For example, a team like the Florida Panthers that generates plenty of scoring opportunities will have a high xGoals for. A team like the Philadelphia Flyers that struggles to defend will have a high xGoals against. These same stats can also be adapted to individual players based on what types of chances are generated when they’re on the ice.
Okay, now that we’re all versed on what these numbers mean, let’s apply this to the Blues. All of the following numbers come from MoneyPuck.
Blues’ Offense
The story with the Blues’ offense was their scoring depth. With nine different 20-goal scorers, they were a threat to score no matter who was on the ice. During the regular season, their 2.96 goals per game was the fifth highest in the NHL.
However, the analytics did not like the shots the Blues were taking. MoneyPuck separates shots into high, medium, and low danger chances. St. Louis’ 118 high-danger shots was the fifth-lowest in the league. Partly because of this, they ranked 18th in xGoals for per 60.

This discrepancy means that the Blues were getting goals on shot attempts that probably shouldn’t have been goals, more so than any other team in the league. Over the course of the season, analytics said that they scored about 54.48 goals above what was expected. Basically, based on the quality of shots the Blues took, they should have scored about 54 less times.
What was responsible for such a huge discrepancy? It comes down to the Blues’ style of play. Throughout the season and into the playoffs, they were at their best when they played a methodical game making heavy use of the boards and trying to get the best shots possible. Their league-best shot percentage (12.4 percent) proves that. The best way to describe that style of offense is “quality over quantity.”
Blues’ Special Teams
All of this extends to special teams as well. The Blues’ power play (26.97 percent) was the second-best in the NHL. Whatever offense they weren’t getting at even strength, they were getting on the power play.
Extending on the “quality over quantity” philosophy, the Blues also converted on 10.48 percent of all shot attempts with the man advantage. While they were middle of the road in terms of the percent of shot attempts taken, the Blues made the most of the opportunities they got.

The strength of the Blues’ special teams made Minnesota the perfect first-round matchup. The Wild took the second-most penalty minutes in the NHL, and their bottom-10 penalty kill made things even worse. The Blues were able to exploit this weakness heavily, scoring on eight of the 26 power-play opportunities they received in the series.
By contrast, the Blues’ penalty-killing unit completely neutralized the Wild’s power play, as Minnesota went 4-for-24 with the man advantage, which was due largely to the lack of quality shots the Blues’ penalty kill allowed. Over the 82-game season, they only were expected to allow 31.13 goals while shorthanded, which was third lowest behind only Toronto and Carolina.
From the beginning of the playoffs, the special teams discrepancy presented a matchup nightmare for Minnesota. Without allowing many quality looks, the Blues were able to make stars like Kevin Fiala non-factors. In order to keep the Blues off the power play, the Wild would have to stay out of the penalty box. They did not, and that was one of the biggest reasons why the Blues won the series.
Blues’ Goaltending
I would be remiss if I didn’t talk about goaltending, as it was the biggest enigma with this team, and it was arguably the main reason the Avalanche won the second round. With the Blues, the story of the regular season was all about the rise of Ville Husso, who earned the starting role over Jordan Binnington, who had a forgettable regular season.
The playoffs were a complete reversal of that narrative. After a remarkable Game 1 in Minnesota, Husso’s lackluster play led head coach Craig Berube to start Binnington, who showed flashes of his 2019 form. After the collision that sidelined him, Husso and the Blues couldn’t perform well enough to slow down the juggernaut that is Colorado.

The advanced stats reflect this too. The main advanced stat used to evaluate goalies is goals saved above expected (GSAx). It uses the same premise as the expected goals mentioned at the top of the article. It determines how many more or less goals a netminder should allow based on the quality of shots against. A goalie with a high GSAx is saving more goals than they should, while one with a negative rating is letting in a fair amount of goals they should be saving.
| Regular Season GSAx Per 60 | NHL Rank (min. 20 GP) | Playoffs GSAx Per 60 | NHL Rank (min. 4 GP) | |
| Jordan Binnington | -0.229 | 43rd | 0.934 | 3rd |
| Ville Husso | 0.346 | 7th | -0.806 | 18th |
During the regular season, 61 different goalies played at least 20 games, so Binnington’s play put him firmly in the bottom third of goalies. In the playoffs, he trailed only Jake Oettinger and Igor Shesterkin for the best GSAx per 60. On the other hand, while Husso was borderline elite during the regular season, only Hurricanes third-stringer Pyotr Kochetkov had a lower rating in the playoffs.
Was Binnington’s postseason play sustainable if he hadn’t gotten injured? There’s no way to tell. He’s played at that level before, but he hasn’t done it consistently since his rookie year. Given his level of play in that sample size, however, there isn’t much reason to believe it wouldn’t have continued, possibly forcing a Game 7 or knocking off the Western Conference champs.
Looking at the reasoning why, it makes sense that the advanced stats wouldn’t favor the Blues. Without taking a high amount of shots or having a true number one goalie, there wasn’t much reason to think that St. Louis could slow down superstars like Kirill Kaprizov and Nathan MacKinnon. However, great special teams and a hot goalie can be all a team needs to win a playoff series, no matter what the analytics say.
