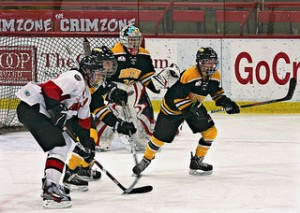
 Here is a look at some of the Canadian Women’s Hockey League 2013-14 award winners and the key statistics associated with their win. At the bottom of this post there will be a chart explaining what some of the lesser known statistics are. Chairman’s Trophy (Top regular season team): Montreal Stars The Montreal Stars have become a perennial power house in the CWHL. They have finished lower than first overall during the regular season only once since 2010. They have also been consistently the best puck possession team in the league They were the only team to have over 50% shots for when they finished at 63%. Currently the shot for statistic from Women’s Hockey Stats is the best marker for puck possession in the CWHL. This shows just how dominant a team they can be including the fact they outpaced the second place team by 16 points. They were also first in the league in terms of team discipline while taking nearly three penalty minutes less per game than the league average.
Over the course of her two seasons in the CWHL career Bettez has become a true star, pun not intended. With 33 goals and 40 assists in 46 games she has taken over for the recently retired Meghan Agosta-Marciano as the premier scorer in the CWHL.
Rookie of the Year: Jillian Dempsey (Boston Blades) In a year that saw the Blades without leading scorer Hilary Knight and Meghan Duggan due to the Olympics, Dempsey was a revelation. She was their leading scorer and a big reason why they were able to keep ahead of the Calgary Inferno for second place in the league. She has earned the chance for more ice time next season when some of the stars if the 2014 Olympics return to the CWHL.
Goaltender of the Year: Delayne Brian (Calgary Inferno) Delayne Brian was a key part of the first Calgary team to make an appearance in the Clarkson Cup tournament. Her and now retired Kathy Desjardins were a solid goaltending tandem and Brian can look to be counted upon next season as the number one goaltender.
My pick: Not to take anything away from Brian’s accomplishments but my pick would have been: Brittany Ott of the Boston Blades. She had a tremendous year and followed the regular season up with a 1.00 goals against average and 0.959 save percentage in three Clarkson Cup games.
Defender of the Year: Cathy Chartrand (Montreal Stars)Chartrand is currently the leader of the Montreal Stars and the top offensive defender in the CWHL. Over the last two seasons she has 14 goals and 36 assists in 46 games played. She is key to Montreal’s effectiveness as a puck possession team with her intelligent breakout passes and offensive zone entries.
What do all these statistics mean?
|