
Do you want to know how many goals and points some of the best Capitals prospects are expected to get without ever playing a single NHL game? In the hockey analytics community, there is a way for doing that. It is what’s known as NHL equivalencies (also known as NHL E).
To calculate a skater’s numerical expectations, you simply start with his goals and points per game from the junior, minor or European league that he was playing in and multiply it by a constant that is known as an NHL translation. That translation is different for each league and was determined after using more than a decade’s worth of data of NHL players playing in one league the previous season to the NHL the following season. Plenty of research has been done by some of the best writers in the hockey analytics world from Rob Vollman in his first edition of his Hockey Abstract to Gabriel Desjardins.
Even if using NHL equivalencies is for looking at prospects, I think it is important to take a look at the experienced Washington Capitals skaters to get a proper grasp of how to properly analyze a player’s development. For this exercise, we will take a look at all the members of the current Capitals skaters that have played over 65 career NHL regular season games (the minimum amount of NHL games played to no longer be considered a prospect, according to hockeysfuture.com) and see how their equivalencies have changed over the years. We have to remember, however, that one of the cardinal rules in analyzing hockey in 2015 is to understand that shooting percentages are so unstable that it can throw even a season’s worth of data out of whack. So instead of looking at each player’s NHL E in a season-by-season basis, we will actually look at them in a cumulative (or career average) basis based off of the work that Garret Hohl did while analyzing Winnipeg Jets prospects. Each cumulative NHL E starts from a skater’s draft year or the year they were signed to a professional contract.
Let’s take a look at Alex Ovechkin’s “draft” season as an example. During the 2003-04 season, “Ovi” would play for Dynamo Moscow in the Russian Super League and score 13 goals and 23 points in 53 games. With the current RSL/KHL to NHL translation being 0.78, Ovechkin’s NHL season would look like this as a 17-year old.
Ovechkin’s NHL E GPG = 13 goals/53 games * 0.78 = 0.191 NHL E GPG = 16 goals/82 NHL games
Ovechkin’s NHL E PPG = 23 points/53 games * 0.78 = 0.338 NHL E PPG = 28 points/82 NHL games
Now those numbers may not look as impressive as the 100+ points he picked up over the peak years of his career, but remember, hypothetically scoring 16 NHL goals before being legally allowed to smoke a cigarette in the United States is still remarkable.
To show an example of how a cumulative NHL E is calculated, let’s use Ovechkin again by adding in his Draft+1 season; his 2004-05 season.
Ovechkin’s NHL E GPG (Draft+1) = 13 goals/37 games * 0.78 = 0.274 NHL E GPG
Ovechkin’s NHL E PPG (Draft+1) = 27 points/37 games * 0.78 = 0.569 NHL E PPG
Ovechkin’s Cumulative NHL E GPG = (0.191 NHL E GPG (Draft) * 53 games + 0.274 NHL E GPG (Draft+1) * 37 games)/(90 total games) = 0.225 NHL E GPG = 18 goals/82 NHL games
Ovechkin’s Cumulative NHL E PPG = (0.338 NHL E GPG (Draft) * 53 games + 0.569 NHL E GPG (Draft+1) * 37 games)/(90 total games) = 0.433 NHL E GPG = 36 points/82 NHL games
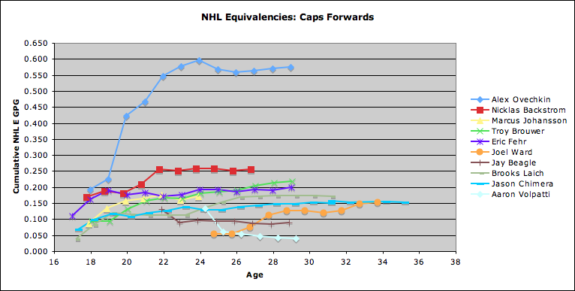
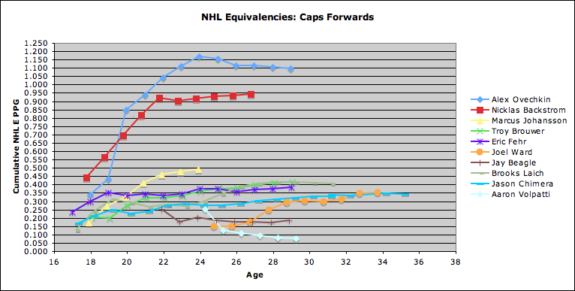
Got it? Good. Let’s go ahead and take a look at the Caps Forwards and see what was generated.
1) I’ll say it once and I’ll say it again:
Using @GarretHohl ‘s method. Um. Whatever Ovi was taking btw his Draft+1 & Draft+2 season, can I have that please? pic.twitter.com/x3JlPIoZaM
— DCSportsDork (@DCSportsDork) February 3, 2015
2) Now with that being said, you could see that all of the European Capitals (Ovechkin, Backstrom, Johansson) numerically started their careers very slowly and then dramatically improved their development over time to become the most productive and dependable players on the team.
However, all three players are starting their hockey careers at the professional leagues in Europe against players much older than them while the rest of the Caps forwards started their careers at either the Canadian junior or NCAA level where they play against players within their own age range. Even being able to play more than half a season at one of Europe’s top hockey leagues at 17 should be good enough to become a first round talent at the NHL level, no matter how small the goal and point totals are.
3) Other than that, by the time a skater begins to enter the NHL or AHL is when you start seeing the expected points per game flat-line. Ideally, you want to have them increase every year, like what you see out of Johansson, Joel Ward and Brooks Laich, but those guys are mainly exceptions to the rule.
4) To keep things simple, a forward gains top-six notoriety when he is projected to average between 0.3-0.35 points per game and about half of that for projected goals per game. You can clearly see that Ovechkin and Backstrom have been bonafide top six forwards throughout their lifetimes. Johansson, on the other hand, has gradually developed into one while Laich, Fehr and Brouwer have hit that mark in their late 20s after going through many developmental struggles and/or injuries along the way.
5) What you see out of the development curves for Jay Beagle and Aaron Volpatti are perfect examples of what a fourth line forward’s age curve looks like. At first, he looks like a productive scorer at the time they were signed or drafted by Washington, but then over time, other skill sets that aren’t measured easily were more regarded. As a result, coaches suggested to such skaters to play a “grittier” brand of hockey that they didn’t show from previous years in order to make the 23-man roster.
6) Now all the NHL E rates seem to be gradually increase over time for each NHL player. This is fascinating considering that as a player ages past their peak years, you would think that the cumulative numbers as the year-to-year rates do as well. Rhys Jessop and Josh Weissbock have been doing research on age-adjusting and draft year-adjusting the NHL equivalencies, but that is only for the Canadian Junior Leagues so far. More research will have to be done for the other leagues.
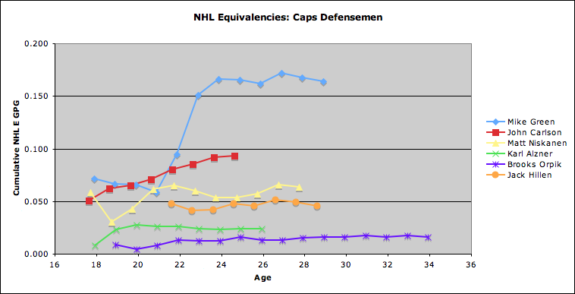
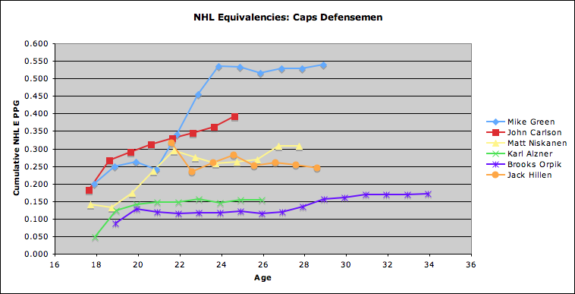
Until then, let’s look at how the experienced Capitals defenseman look like over the years.
1) In order to be considered a “puck moving” defenseman, it seems like putting up an expected rate of 0.25 points per game and about a third of that in goals per game would be a good standard. Anything less than that is ideal for a third pairing blueliner or one that would be expected to “shut down” the opposition.
2) Like the forwards, by the time a defenseman makes it to even the AHL, let alone the NHL, the developmental curve stops dramatically increasing.
3) That is, unless your Mike Green, John Carlson or Matt Niskanen. Carlson’s is the one that fascinates me the most while as Green’s standards have never been the same since his three year offensive outburst from 2007-2010. Niskanen clearly had his expectations go up after having a breakout final season with the Pittsburgh Penguins that helped him receive a long term contract in D.C. last summer.
There you have it. Those are the “basic” things to look at when analyzing and calculating scoring expectations for a skater heading into the NHL. I will say one thing before closing this out.
In the future, I would like to see what happens to a player’s development when receiving a vast amount of playing time in the AHL after looking through the entire NHL database. One recent criticism about the Capitals’ affiliate, the Hershey Bears, has been that the focus has been too much on winning Calder Cups and not enough on developing young players. This can be seen with how the likes of Chandler Stephenson, Nathan Walker, Caleb Herbert and Stanislav Galiev were never given top roles right away and some have even had to be sent to the proverbial dungeon that is the ECHL. Unless you’re a goaltender, you do not want to play there for a very long time or you might as well kiss your NHL career goodbye. I’m not suggesting that the young prospects need to be given special treatment, but someone in the Capitals and Hershey Bears front office has scouted the Kris Newburys of the world enough to recognize that this is a detriment to a player’s development to time and again play below these types of players in the forward lines or defense pairings.
So with that in mind, keep your eyes peeled for my next post regarding how the prospects look in the next couple of days.
According to your formulas then, Alex Giroux and Keith Aucion should have had amazing NHL careers. How do you “analyze” why they didn’t? You just spent several hundred words saying that NHL players do not improve continuously over their career, but they plateau at a certain level (which is different for every player). Duh!
You just included Volpatti to be mean, didn’t you?