The recent Stanley Cup Final featured a goalie matchup between Braden Holtby of the Washington Capitals and Marc-Andre Fleury of the Vegas Golden Knights. And while many statistics were used to favor one goalie or the other, a surprising statistic favored both.
It turns out, Stanley Cup winning goalies aren’t the regular season’s ironman goalies. During the regular season, Holtby only played in 54 games, just 17th most in the league. Fleury only played in 46 games, all the way down at 26th. While some might dismiss this, it fits into a decade-long trend.
The Stanley Cup-winning goalies over the last decade include Matt Murray (2 times), Jonathan Quick (2), Corey Crawford (2), Tim Thomas, Antti Niemi, Fleury and Holtby.

Goalie Averages
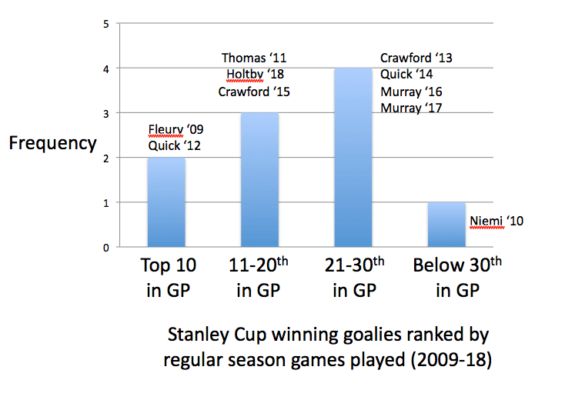
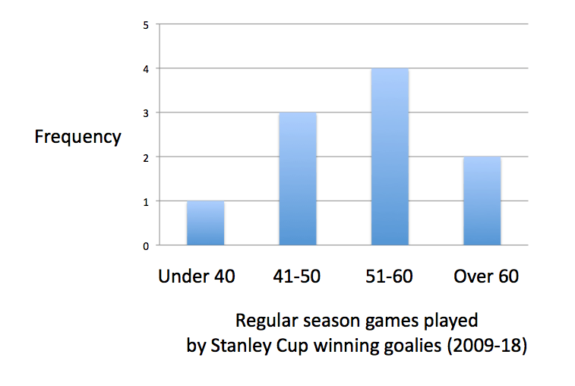
An average starting goalie will play about 70% of his team’s regular-season games, which equates to 58 games (58 games will usually place a goalie about 15th in games played (GP)). Yet in the past decade, only two Stanley Cup-winning goalies played 58 or more regular season games.
In these ten seasons, one goalie finished fourth in GP and another finished eighth. But no one else finished higher than 15th in any of the other eight seasons. One of the ten finished outside the top 30 in GP (technically two, but see Zeke’s Notes below for the explanation).

Indeed, in the last six seasons, none of the Stanley Cup Final-winning goalies was among the top 15 in GP during the regular season. In four of the last six seasons, the Cup-winning goalie was outside the top 20 in regular season GP! While each situation is different, this doesn’t have a fluky feel to it. Eight of the last ten seasons is a healthy sample size. And six seasons in a row doesn’t seem like an anomaly.
Goalies, Hot and Cold
There is a lot to be said for a hot goalie in the playoffs. They can change games and often decide a series. Goalies aren’t often Conn Smythe winners, just four goalies have received the award since Patrick Roy won his last in 2001 (one of the four, Jean-Sebastien Giguere, captured it in a losing effort). I don’t think this is simply about a hot goalie.

A team can’t get to the Stanley Cup Final if it doesn’t win all its earlier series. While a hot goalie can win a series, I suspect the trend we’re looking at represents the flip side of this effect. One so-so series can torpedo a team and an overworked goalie is more likely to have some ‘off’ games. A goalie must be ‘locked in’ both mentally and physically. A fresher goalie is more likely to stay locked in longer and recover more quickly if things go wrong.
My sense is goalies who play less during the regular season are more capable of putting together multiple strong playoff series and are less likely to have a few poor games which can end a team’s chances.
Recent Goalie History
This season, nine playoff teams featured goalies that played 58 or more regular season games, including Martin Jones, John Gibson, Devan Dubnyk, Jonathan Quick, Andrei Vasilevskiy, Sergei Bobrovsky, Frederik Andersen, Pekka Rinne and Connor Hellebuyck. Last season, the list saw 11 playoff goaltenders topping 58 regular season games, including Cam Talbot, Andersen, Tuukka Rask, Dubnyk, Jones, Holtby, Bobrovsky, Jake Allen, Rinne, Carey Price and Henrik Lundqvist.
Of 32 playoff teams in the past two seasons, 20 had goalies which met or exceeded 58 regular season games (62%). Four goalies made the Final from these two seasons, but just one from the above lists (25%, the lone goalie is Nashville’s Pekka Rinne from the 2016-17 season). The three other goalies which made it to the Final in these seasons each played less than 58 regular season games.

Trying to look for rational explanations for goalie performance is, well, challenging. As Zachary DeVine often opines “goalies are voodoo.” The trend we’ve identified doesn’t exclude the possibility of a heavily used goalie winning a Stanley Cup. But since the odds seem to be stacked against it, it merits a careful look. Every coach wants to see his teams win the championship and it’s worth exploring the things which move the odds in his team’s favor.
Zeke’s Notes
The data above contains a couple of oddities and I’ll explain how I handled them here:
One non-standard data point comes from the 48-game season played in 2013. Corey Crawford played in 30 of the 48 games, a bit over 60% of the Blackhawks’ games. This scales to 51 games over an 82 game season. And while this data point fits the premise, I’m wary of applying lessons from a 48-game season to an 82-game season. Still, I included the data point in the analysis. It was pretty close to the midpoint with normalized data (i.e. rankings). On the graph for GP, I used the scaled figure of 51, not 30.
The second non-standard data point occurs with Matt Murray’s 2015-16 season. He played 13 games for the Penguins and while it’s tempting to use this figure, it’s also misleading. Murray played 31 games in the AHL and given this article compares goalie use to playoff performance, these 31 games matter. I combined his AHL and NHL stints, 44 GP in total. Forty-four would have him ranked 24th in NHL GP for 2015-16.