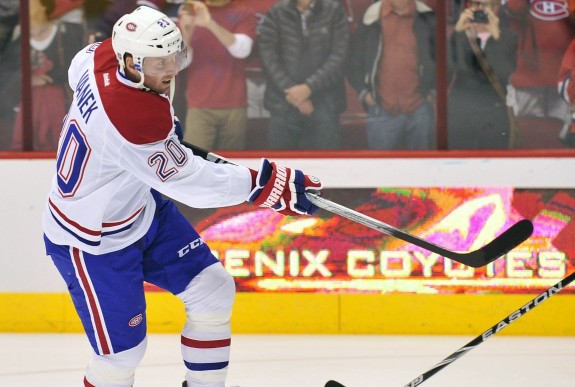
The Thomas Vanek signing has proved to be a little divisive among the State of Hockey faithful. Many are excited and see the Wild nabbing one of the NHL’s elite scorers, but a surprising number have been skeptical following a mild playoff performance from Vanek where he scored just five goals and five assists in 17 games before the Montreal Canadiens lost to the New York Rangers in the Eastern Conference Final.
Many are comparing the Vanek signing to the Dany Heatley signing three years earlier that handcuffed the team to a cap hit of $7.5M annually. Heatley didn’t work out. Many wanted him bought out after his second season, but a injury prevented that and his performance on-ice continued to be below the level of his salary. (Though he did provide value and leadership to the team, just not $7.5M worth of value and leadership.)
The comparison initially seemed ludicrous to me, stemming in part from some parallels that don’t necessarily effect a player’s performance. They were both 30-years old when they began their three-year deals with Minnesota after playing nine NHL seasons. The prices are even similar, though Vanek costs $1M less against the cap at $6.5 annually.
A lot of the criticism of Vanek ignores that the 2013-14 season was an especially difficult one for him — and would have been for any player. He played for three different teams, played in the Olympics, played through constant trade speculation and contract talks, and played on a team that made it to the Eastern Conference Championships. That’s a lot of games on a lot of different lines and a lot of non-hockey distracting him from the shifting job at hand.
The other reason that tales of his decline are overblown is that posts like this one tend to mention that Vanek hasn’t scored 40 goals since 2008-09 and hasn’t hit the 30 goal mark since 2010-11. What those complaints fail to mention is that he was on a team with little support (2010-11 was the last time the Sabres made the playoffs) and that in the 2012-13 lockout-shortened season, Vanek was on pace for 43 goals.
But, let’s take the comparison seriously and see if there is reason for concern, reason to believe that Vanek might be Heatley Part Deux.
The Raw Deal
Let’s start by looking at the basics, the raw numbers. (There’s an infographic at the bottom of this post where all of these numbers are laid out.)
Both Vanek and Heatley came to the Wild at 30-years old and were on a three-year contract. Both had played nine NHL seasons before signing. Vanek has played 663 regular season games and Heatley had played 669 regular season games.
At a glance, looking at raw production, Heatley came to the Wild with a stronger career behind him. He scored 325 goals and 364 assists (regular season) before joining the Wild, whereas Vanek only has 277 goals and 279 assists. Heatley simply produced all the time.
Notably, Heatley scored at least 39 goals for five straight seasons, a stretch that included two 50-goal seasons, a mark Vanek has never hit. The year before arriving in Minnesota was the year where that streak was broken. He scored 26 goals for San Jose over 80 games.
Vanek has just came off 27 goals over 78 games, playing for Buffalo, the NY Islanders, and Montreal last season. As I said before, I think it’s a tough season to judge him on, being that he played on more lines than almost anyone in the NHL. The season before (would be compared to Heatley’s 39 goals in 82 games for San Jose in 2009-10) was the lockout-shortened season where Vanek was on pace to score 43 goals if he played all 82 games.
I’ll be honest, I was surprised by these numbers. I thought their raw totals would be closer. Heatley, over a very similar quantity of games, produced far more offense than Vanek.
(Side note: I know I’m focusing a lot on goals here, but both players are dynamic goal scorers who were acquired by Minnesota to cure offensive issues. I’m focusing on offensive production, because that’s what Wild brass hope to see from Vanek and what they hoped for from Heatley.)
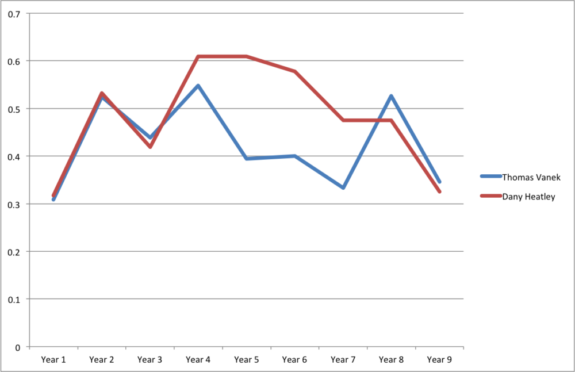
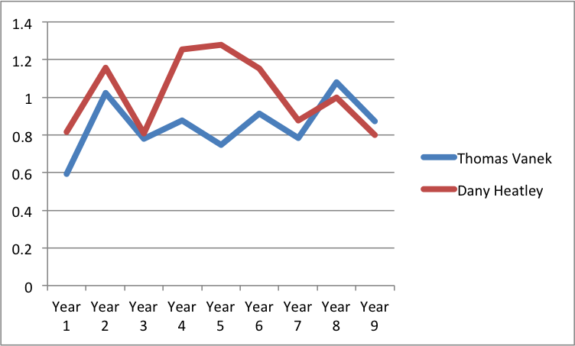
I graphed their goals per game and total points per game production to put a finer point on the divide. I’m not looking at advanced stats, just the raw totals graphed out per game to compare the two on a per game basis.
When you look at points per game you see that Heatley is actually producing more offense than it seems when you look at just goals. Heatley was dynamic and amazing in his prime.
However, in Year 8 and Year 9, Heatley drops off quite a bit and falls below Vanek in raw production. Take a look and we’ll come back to this.
Goals Per Game
Points Per Game
Digging Deeper
In raw totals it’s clear that Heatley has an edge in scoring on Vanek. The question is whether advanced stats back that up or if there’s more to the story.
Since Heatley’s numbers run a little further into the past, grabbing detailed advanced stats can be tricky, so I’m largely focusing on the final three years in each players career before joining the Wild. The seventh, eighth, and ninth years of their respective careers. This should give a sense of whether there’s reason to be concerned that Vanek is on the same downward trend that Heatley was on when he arrived in Minnesota.
We’ll start with shooting percentage. It can be tricky to try and reach a conclusion from shooting percentage alone since it can mean so many things, but we can use this as a point of reference later. I’m wary of drawing too much of a conclusion from shooting percentage because a high shooting percentage could mean the player is a sniper or that he’s having a statistical aberration and will regress to the mean in following seasons.
If they’re a sniper, do you plan on always having that accuracy or is it better to have someone with a lower shooting percentage and the same number of goals? The latter is presumably creating more offense through taking lower percentage shots and getting dirty in front of the net. That’s one interpretation and there are a hundred others if you look at shooting percentage alone. You get the idea. Here are the shooting percentages over both players’ nine seasons preceding the Wild.
Shooting Percentage
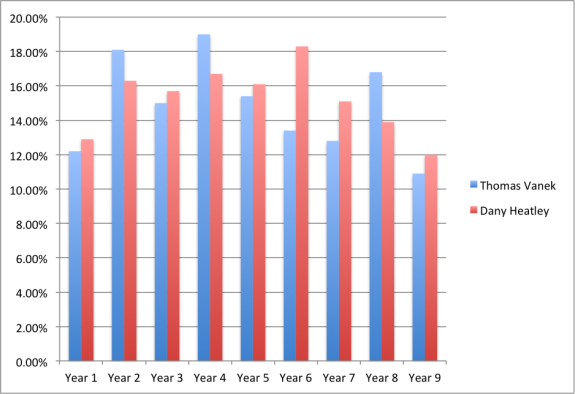
For seasons prior to joining the Wild both players see a decrease in shooting percentage, with the exception of the lockout shortened season for Vanek where he jumped up to 16.8%. In four of the five years before joining the Wild, Heatley had a better shooting percentage than Vanek. However, Heatley’s numbers continued to drop when he joined the Wild, registering just 10.1% in his first season in Minnesota. These numbers don’t tell us anything definitive, but are a good reference point for the information to follow.
Next let’s look at the two players’ G/60 (goals per 60 minutes of playing time, regular season, all situations), remembering that Heatley outscored Vanek by quite a large margin overall.
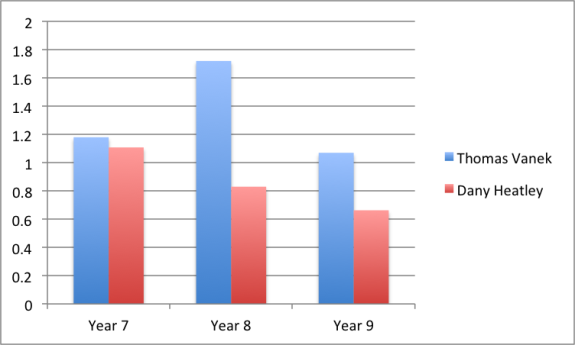
Over the three seasons prior to joining the Wild, Vanek’s G/60 is quite a bit better than Heatley’s. It would also appear that Vanek’s shooting percentage decline doesn’t have a direct correlation to his G/60. Heatley’s G/60 more-or-less follows his decline in shooting percentage.
Add to that their A/60 (assists per 60 minutes of game time, regular season, all situations):
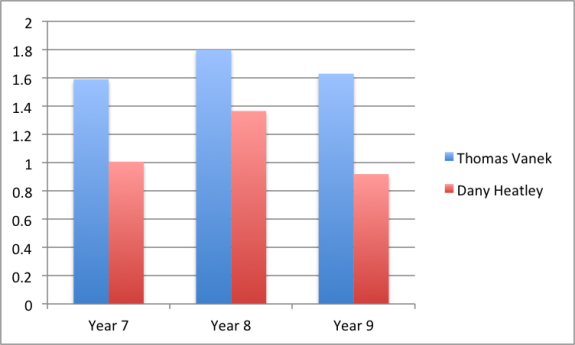
Again, Vanek is ahead of Heatley in all three years.
Let’s temper those and the shooting percentage with a look at their shots/60 (shots per 60 minutes of playing time, regular season, all situations).
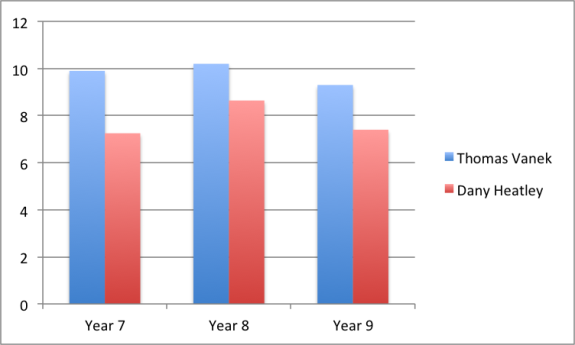
Again, Vanek produced more in all three seasons leading up to their respective signings in Minnesota.
What does it all mean?
As we compare the raw totals to the advanced stats it seems clear to me that any regression we see in Vanek’s offensive production is not the same as the regression we saw with Heatley. The advanced stats tell a different story than the raw stats. Part of that is the lockout shortened season throwing off Vanek’s overall totals due to fewer games played despite a solid scoring pace.
Heatley’s overall stats in that nine year span are better. However, in the final three years he only bests Vanek during Year 7 in goals per game and points per game. Vanek’s numbers are on the decline, but for the first time in that nine year time span, he’s putting up better points per game numbers than Heatley.
Bringing those totals to the advanced stats, we see that even when Heatley was producing more goals and points overall, Vanek was a more effective player, besting Heatley through all three years in G/60, A/60, and Shots/60.
Vanek saw some decline in overall numbers, but his productivity on the ice isn’t in free-fall. In fact hiss G/60, A/60, and Shots/60 all go up in Year 8 compared to Year 7. Year 9 is a slight step back from Year 8, but his G/60 and A/60 are higher than they were in Year 7. That shows that there isn’t a complete downward trend on the graph.
The slight downtick in G/60 and A/60 in Year 9 compared to Year 8 could be attributed, as I talked about earlier, to playing on three teams, a ton of lines, and working through the Olympics. You want players to fight through anything, but a very slight downtick through a tumultuous year doesn’t indicate a downward trend in a career overall.
Man with a Vanek
That indicates to me that the similarities between these two players entering their respective first year in Minnesota stop at the surface. There’s no doubt that Heatley is a great player, but Vanek is a different player entirely and appears to carry less risk of the kind of overpayment for the performance received that Heatley became slightly reviled for in Minnesota.
I would add that over that three-year span (Years 7-9) Vanek was on a worse team than Heatley was. Vanek spent three years on a weak Sabres team and Heatley had two with the Sharks and one with Ottawa. Heatley was on a playoff team two of those three years, Vanek was on a playoff team for 18 regular season games over those three seasons.
In the end, the comparisons have solid grounding, but prove to be inaccurate. Vanek hasn’t hit the totals he hit earlier in his career, but that could be explained away by the lockout hindering what looked to be a big year and free agency making last season rather complicated. He’s still a productive player who isn’t seeing the kind of downward trend that should raise red flags for fans in the land of 10,000 lakes.
**
Thomas Vanek advanced stats taken from Extra Skater. Dany Heatley advanced stats taken from Stats.HockeyAnalysis.com. Salary information taken from Cap Geek.

There was also the hope that Heatley would bring chemistry with Devin Setoguchi who was also brought over from the Sharks. That never materialized, thankfully. Also, in the end, it was a better deal than keeping Martin Havlat.
You’re correct. I used “signed” as shorthand for acquired and that’s inaccurate.
As far as the deal making sense, I understand and don’t refute that. The article is more interested in what actually happened and tracking the trends between the two players that could give an indication or what may happen through this next phase of Vanek’s career.
This article repeatedly states that the Wild signed Heatley to a three-year $7.5 million-cap-hit deal. That is incorrect.
Heatley actually signed a six-year $45 million extension with Ottawa in 2007 that went through the 2013-2014 season. He was then traded to San Jose in 2009. The Wild traded a disgruntled Martin Havlat to San Jose in 2011 for Heatley.
A $7.5 million per year contract for Heatley in 2011 would have been a massive overpayment, but the Wild needed to dump and replace him with a veteran winger, so they made the trade despite the huge cap hit. The deal makes a lot more sense in that context.