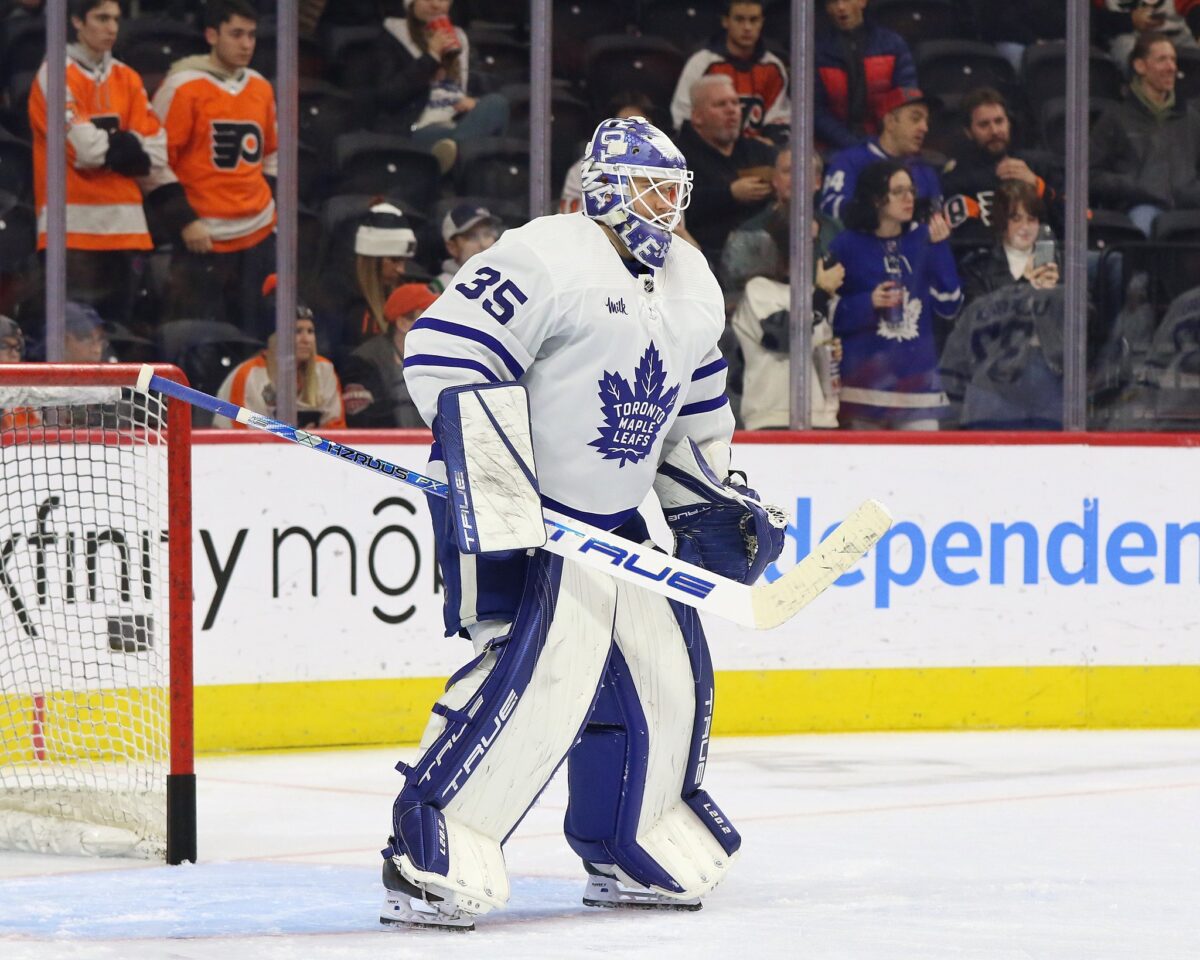
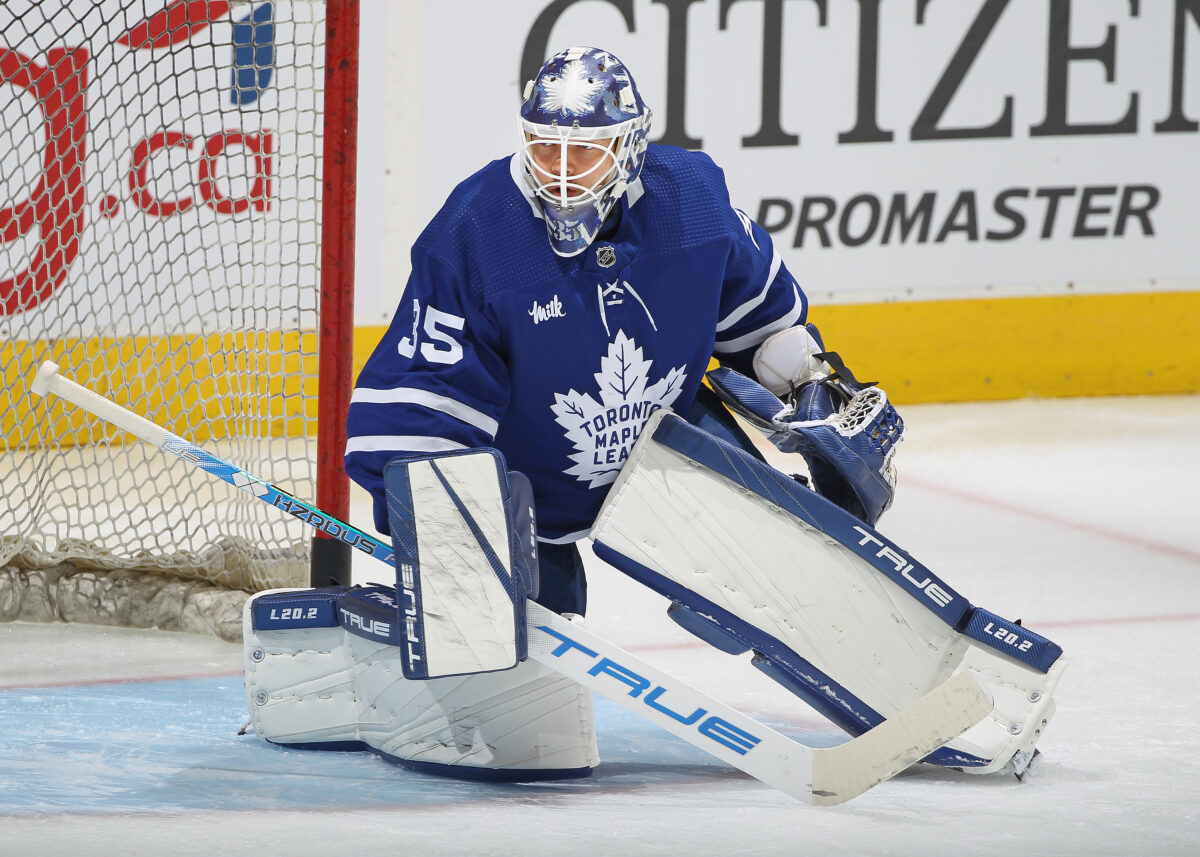
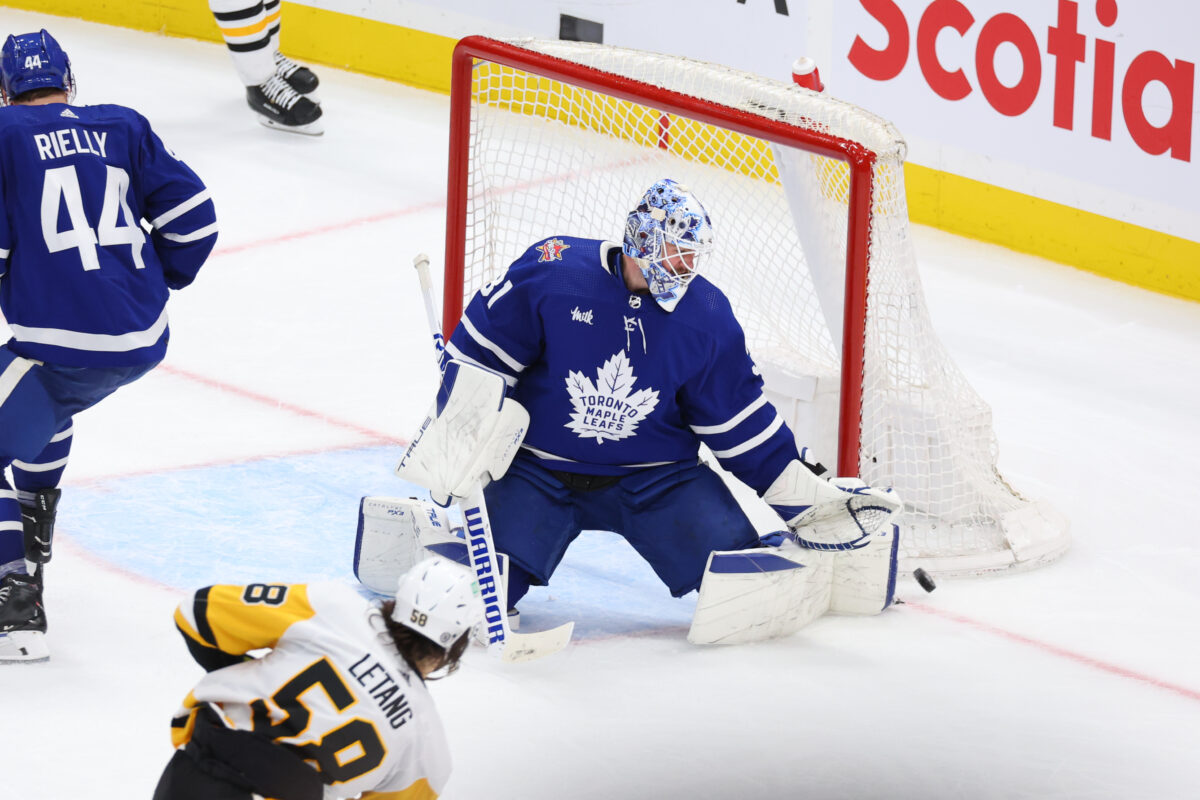
Dave Feschuk of the Toronto Star recently wrote an article with the title “It’s easy to blame goaltending for the Maple Leafs’ problems. It’s also wrong.” His point was that the Toronto Maple Leafs’ dismal results against less-than-stellar opposition have taken a toll, and Ilya Samsonov was hardly the only reason.
After Feschuk wrote the article, Toronto passed its next test on Saturday (Dec. 23) in Columbus against the Blue Jackets. However, he had quoted head coach Sheldon Keefe following the 9-3 blowout by the Buffalo Sabres as stating that “There was a highway to our net” (from “It’s easy to blame goaltending for the Maple Leafs’ problems. It’s also wrong,” Dave Feschuk, Toronto Star, 23/12/2023).
Keefe also added, “We’ve got to make it way harder for teams to get to our net.” In essence, he appears to be putting more of the blame on the players in front of Samsonov than on Samsonov himself. Taking Feschuck’s point seriously, in this post we want to help test his premise about Samsonov.
Feschuk’s Premise Was That Samsonov Was Not Fully to Blame
Feschuk’s post made the point that blaming Samsonov’s poor performance on him was wrong. He also went on to write that the Maple Leafs had a deserved reputation for playing down to the competition and playing poorly against teams behind them in the standings.

That brings us back to the relationship between a goaltender’s performance and the performance of the team in front of him. It also begs the question of whether Samsonov’s struggles are more about Samsonov, or more about the Maple Leafs’ defensive lapses.
Utilizing the Advanced Analytic of Expected Goals
There is one statistic that attempts to separate a team’s defensive play and the play of a goaltender. That statistic is expected goals against. Before going further, we want to state that it is not a perfect statistic. It has its flaws just like any other statistic. However, accepting it for what it is – another way of gaining insight into an on-ice set of occurrences – here is a description from the website novacapsfans.com about how expected goals are calculated.
Related: Ex-Maple Leaf Wendel Clark Weighs in on Current Leafs Stars
“For those that aren’t familiar with the xGF metric, in the simplest of terms, the stat simply applies additional characteristics to your typical shot stat, including shot location, shot type, and other relevant descriptors. Each shot is then given a value based on success rates for that specific shot type and location becoming a goal, based on years of historical data for that shot location and type.”
From reading that description, it is obvious that determining expected goals is not an exact science. It is not the same as actual goals where the puck is either across the goalline or it isn’t. Some decision-making is involved by whomever is calculating the statistics.
Overall, however, expected goals is a useful tool to help analysts separate a goalie’s performance from that of the skaters in front of him.
Looking at Samsonov’s Expected Goals Against vs. His Actual Goals Allowed
With that in mind, let’s go through each game Samsonov has appeared in and compare his expected goals against with his actual goals against.
| Game # | Expected-Goals Against | Actual-Goals Against | Plus/Minus Expected vs Actual Goals |
| 1 | 2.13 | 5.00 | +2.87 |
| 2 | 3.31 | 4.00 | +0.69 |
| 3 | 2.33 | 2.00 | -0.67 |
| 4 | 0.31 | 3.00 | +2.69 |
| 5 | 2.30 | 3.00 | +0.70 |
| 6 | 4.39 | 2.00 | -2.39 |
| 7 | 0.78 | 4.00 | +3.22 |
| 8 | 4.31 | 2.00 | -2.31 |
| 9 | 2.24 | 2.00 | -0.24 |
| 10 | 2.30 | 4.00 | +1.70 |
| 11 | 1.78 | 0.00 | -1.78 |
| 12 | 3.24 | 4.00 | +0.76 |
| 13 | 3.83 | 6.00 | +2.17 |
| 14 | 1.36 | 5.00 | +3.64 |
| Average | 2.47 | 3.29 | +0.82 |
Of the 14 games Samsonov has played, he has allowed more goals than expected in nine of those games. He has allowed fewer goals than expected in five games. On average, he has allowed 0.82 more goals than expected, almost one complete goal per game.

That would indicate that Samsonov’s struggles are more about Samsonov himself and not the skaters in front of him.
Looking at Joseph Woll’s Expected Goals Against vs. His Actual Goals Allowed
Just out of curiosity let’s look at Joseph Woll’s expected and actual goals against for each game he has played.
| Game # | Expected Goals Against | Actual Goals Against | Plus/Minus |
| 1 | 2.42 | 3.00 | +0.58 |
| 2 | 3.32 | 0.00 | -3.32 |
| 3 | 3.98 | 1.00 | -2.98 |
| 4 | 3.66 | 1.00 | -2.66 |
| 5 | 2.71 | 4.00 | +1.29 |
| 6 | 3.52 | 5.00 | +1.48 |
| 7 | 2.60 | 1.00 | -1.60 |
| 8 | 3.75 | 6.00 | +2.25 |
| 9 | 2.13 | 4.00 | +1.87 |
| 10 | 3.06 | 3.00 | -0.06 |
| 11 | 3.39 | 3.00 | -0.39 |
| 12 | 3.74 | 1.00 | -2.74 |
| 13 | 4.37 | 3.00 | -1.37 |
| 14 | 3.57 | 4.00 | +0.43 |
| 15 | 2.22 | 2.00 | -0.22 |
| Average | 3.46 | 2.73 | -0.73 |
Of the 15 games Woll has played, he has allowed fewer goals than expected in 10 of them and more goals than expected in five of them. Overall, he has allowed 0.73 fewer goals than expected.
Related: Maple Leafs’ Samsonov Shows Human Side of Professional Sports
According to expected goals, the Maple Leafs played better defensively with Samsonov in goal (2.47 expected goals against) than they did with Woll between the pipes (3.46 expected goals against). Yet, in goal, they have allowed more goals against per game (3.29) than they have allowed with Woll in the net (2.73).
Looking at Martin Jones’ Expected Goals Against vs. His Actual Goals Allowed
Although he has only made six appearances, two of them in relief, we also want to look at Martin Jones’ numbers as well.
| Game # | Expected Goals Against | Actual Goals Against | Plus/Minus |
| 1 | 1.09 | 1.00 | -0.09 |
| 2 | 3.88 | 3.00 | -0.88 |
| 3 | 3.30 | 0.00 | -3.30 |
| 4 | 2.21 | 4.00 | +1.89 |
| 5 | 1.74 | 4.00 | +2.26 |
| 6 | 2.01 | 1.00 | -1.01 |
| Average | 2.37 | 2.17 | -0.20 |
These numbers show that Jones has played slightly better than the team in front of him has played. He also has given up fewer goals than expected in four of his six appearances. If we take his two relief appearances out of the equation and just look at his four starts, we see his expected goals are 3.03 per game and his actual goals are 2.00, or 1.03 goals better than expected.

Just to make things easier to look at in one space, let’s show a direct comparison between the average expected goals against and the actual goals against for each of the three goalies.
| Goalie | Expected Goals Against | Actual Goals Against | Plus/Minus |
| Samsonov | 2.47 | 3.29 | +0.82 |
| Woll | 3.46 | 2.73 | -0.73 |
| Jones | 2.37 | 2.17 | -0.20 |
The Bottom Line About Samsonov as a Maple Leafs Goalie
If a comparison between expected goals against and actual goals against can separate the play of a goaltender from the play of the team in front of him, it appears that the Samsonov problem is indeed a problem with Samsonov himself and not a problem with the skaters in front of him.
Personally, we don’t think the blame is solely on Samsonov. We agree with Keefe that the team in front of him has to take some of the blame. They have to play better defensively to help Samsonov be better.
Related: Hitting in Women’s Hockey: Why Not?
That leads us to another intangible factor we feel needs to be mentioned that you can’t put a measurement to. That measure is the symbiotic relationship between a goalie and the players in front of the goalie.
The theory is that, if the skaters on a team have confidence in their goalie, they will relax more and play better. If they do not have confidence in their goalie, they will not be comfortable and will feel the need to alter their play in an attempt to assist him. They will also not be relaxed in their play and will be more prone to making mistakes.
Because we cannot measure this relationship, we cannot say with certainty it’s the case with the Maple Leafs. However, the possibility does have to be considered. If it is a factor, it would mean that even some of the mistakes the skaters are making are being made simply because Samsonov is in the net.
[Note: I want to thank long-time Maple Leafs’ fan Stan Smith for collaborating with me on this post. Stan’s Facebook profile can be found here.]
