I’ve written about it, others have written about it and it’s clear from watching their games: the Nashville Predators offense is struggling this season. The result is a team with Stanley Cup aspirations could find themselves ousted in the first round of the postseason thanks to their inability to generate depth offense.
The Predators’ top line of Viktor Arvidsson, Filip Forsberg and Ryan Johansen is as talented as most teams’ first lines, but there’s a steep dropoff in production in lines two through four. For the season, Predators forwards have totaled 367 points and the top line has combined for 135, or 36.8 percent, of those points.
However, with the deadline deals that shipped Kevin Fiala and Ryan Hartman out, current Predators forwards not named Arvidsson, Forsberg or Johansen have combined for 180 points. That means of the 315 points scored by forwards currently on the NHL roster or in the AHL, the top line has accounted for 42.9 percent, while the remaining 19 players have represented 57.1 percent. That is heavy reliance on a first line that opposing teams can line-match against in the postseason.
This issue should alleviate some from now until the postseason. Mikael Granlund and Wayne Simmonds, trade deadline acquisitions, will contribute down the stretch and provide depth scoring. However, the reality remains that if other forwards don’t step up, the Predators will struggle come playoff-time.
Yet that doesn’t mean every Predators depth forward has underperformed this season. Some players, like Nick Bonino and Rocco Grimaldi, have been surprising sources of offense. But the one player who has jumped off the page relative to expectations is Colton Sissons. The Predators’ 25-year-old all-purpose forward has played down the middle and on the wing this season, and has spent time on all four lines. It’s because of his ability to thrive in all situations that he has been this season’s MVP, the most valuable Predator.

Sissons’ Production Is More Than the Counting Stats
On the surface, Sissons’ stats aren’t anything to get excited about. In 63 games this season, he has 11 goals and 25 points. Those aren’t great numbers, although his 11 goals are already a career high and his 25 points are two away from the 27 he totaled last season. However, he is shooting 12.8 percent, well below his career high of 19 percent, and is averaging 16:12 in ice time per-game, the highest of his career.
What’s interesting is that he has a plus-14 turnover margin while starting in the offensive zone just 33 percent of the time. Oh, and although plus/minus is for the most part an archaic stat, his plus-24 is second-highest on the team and ties for 14th in the league. Plus/minus has little to do with an individual’s impact, but a plus-24 suggests that Sissons does an excellent job at preventing goals despite receiving non-advantageous zone starts.
Rate Stats Best Describe Sissons’ Production
However, Sissons’ production is best understood when looking at his rate stats due to the limited minutes he plays. His .17 goals-per-game and .40 points-per-game are both career highs and he’s attempting 1.37 shots-per-game. He has also already surpassed his previous career highs in offensive point shares with 0.8, defensive point shares with 2.7 and total point shares with 3.5.

At five-on-five, he’s averaging .55 goals-per-60 and 1.42 points-per-60 (P/60) while skating a career-high 12:05 per-game. The combination of his 1.56 P/60 when adjusted for score and venue, plus average ice time, led Shawn Tierney to label Sissons as ‘underused.’ He’s in a category with teammates Bonino, Grimaldi, Brian Boyle and Craig Smith, while Granlund, P.K. Subban and Dan Hamhuis are labeled ‘overused.’ Part of this labeling reflects usage as the more a player plays the more likely it is that his scoring rates decrease. However, in Sissons’ case it’s different because he is playing over 12 minutes a night at five-on-five and is still considered underused.
Tierney’s work also suggests that Sissons has been unlucky. His shooting percentage, average shot distance of 25.09 feet and 68.25 on-target percentage lead to an expected goal total of 13.6, two more than the 11 goals he’s actually scored. So, to recap, he’s near or has already eclipsed career highs in scoring totals, has strong rate stats, has been slightly unlucky and is underused. Those are all good points. But in my opinion, what makes Sissons such a great player is that’s been a positive-impact player in nearly every situation.
A Positive-Impact Player
As I alluded to in the introduction, Sissons is an all-purpose forward. He takes faceoffs, with 666 this season and a 52 percent success rate, and he plays in all situations, including 1:23 per-game on the power play and 2:02 per-game on the penalty kill. And what’s amazing is that he succeeds in pretty much every situation and role. It starts at five-on-five, where he’s one of the Predators’ best at exiting the defensive zone and entering the offensive zone.

Zone Entry and Exit Machine
In the Predators’ most-recent game, a 5-3 loss to the Carolina Hurricanes on March 9, Sissons’ ability to exit the defensive zone, get through the neutral zone and enter the offensive zone was on full display. At one point in the game, the Predators were pinned down in their own zone as the Hurricanes had momentum and were attacking.
After a lengthy period of time, Sissons gained possession of the puck, and instead of icing the puck or making a risky pass, he calmly skated the puck out of the defensive zone. However, his efforts didn’t stop there. Rather than reaching the red line and dumping the puck into the offensive zone, he carried the puck and got it in deep by passing it off the boards to himself, eluding a defender. With the puck in deep, he started the Predators’ cycle as his teammates changed and joined him, and the play eventually led to a scoring chance that was started by Sissons’ efforts.
This play was just one in an individual game, but it is indicative of what he’s done all season. His ability also shows up in various advanced metrics, namely Corey Sznajder’s zone entry and exit data. At five-on-five, Sissons enters the offensive zone via carry-in 50 percent of the time and averages 14.89 zone entries per-60 minutes. Both are below league average for a forward (50 percent and 19.30, respectively), but his rates are higher than several Predator forwards, most notably Miikka Salomäki, Bonino and Johansen.
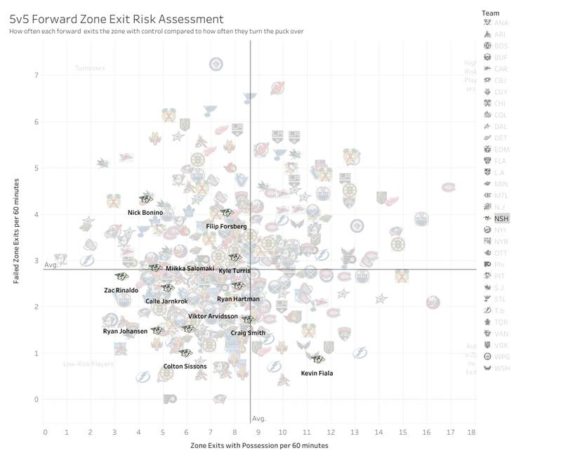
It’s a similar story with five-on-five zone exits. Sissons averages 5.96 zone exits with possession per-60 minutes and only .993 failures per-60 when exiting the defensive zone. By comparison, NHL forwards average 8.66 exits with possession and 2.80 failures per-60. So while he may not have as many zone exits as the league average, he is much safer in doing so. Among Nashville forwards, only Fiala had fewer failures per-60, making Sissons the team’s least risky current forward at exiting the zone. Meanwhile, Forsberg, the team’s most talented forward, averages 4.02 failures per-60. That is a substantial difference.
Production of Sissons’ Lines
Sissons’ positive impact continues when looking at the lines he plays on. Again using Tierney’s data, and looking at the five most-common Predators lines that include Sissons, reveals that four of the lines have positive expected goal differentials per-60 minutes, meaning he’s on some of the Predators’ best lines.
His most-used line with Bonino and Austin Watson has an expected goal differential of plus-.07. His second-most common line with Fiala and Smith is the line with a negative goal differential at minus-1.83 thanks to a team-worst 3.61 expected goals allowed per-60. Other lines he’s been on include one with Salomäki and Zac Rinaldo with a team-low .943 expected goals allowed per-60, one with Bonino and Hartman and one with Hartman and Calle Järnkrok. Additionally, Sissons is on Nashville’s best line in expected goals for per-60 at 4.27 with Fiala and Kyle Turris.
Impact on Linemates
So Sissons is on some of Nashville’s best lines in terms of expected goal differential, but that’s understandable as the Predators have a team goal differential of plus-18. But what’s more impressive is that Sissons is a positive impact on the majority of his linemates. Of his five most-common linemates this season – Bonino, Watson, Järnkrok, Hartman and Fiala – Sissons improves each in at least one metric. This includes improving Hartman and Watson in all four categories. The table below shows each player’s metrics with and without Sissons (’10’).
|
Player |
Shots For % | Goals For % | Scoring Chances For % | High-Danger Chances For % | ||||
| With 10 | W/out 10 | With 10 | W/out 10 | With 10 | W/out 10 | With 10 |
W/out 10 |
|
| Bonino | 52.0 | 49.7 | 75.0 | 70.6 | 48.0 | 50.0 | 47.0 | 50.0 |
| Watson | 50.8 | 43.1 | 81.8 | 54.6 | 51.5 | 41.1 | 46.9 | 37.5 |
| Järnkrok | 54.8 | 48.5 | 54.6 | 60.5 | 49.6 | 49.8 | 50.0 | 46.7 |
| Hartman | 60.2 | 49.8 | 70.0 | 50.0 | 53.3 | 49.5 | 60.0 | 46.5 |
| Fiala | 51.0 | 52.0 | 66.7 | 43.9 | 50.9 | 52.7 | 52.9 | 53.1 |
Threat Levels With and Without Sissons on the Ice
Furthermore, using Micah Blake McCurdy’s data at HockeyViz, we learn that Sissons improves Nashville’s threat level in nearly every situation. In terms of shots for at five-on-five, the team’s threat with Sissons on the ice is minus-eight percent; without him, it’s plus-seven percent. That doesn’t support the argument that Sissons is a positive-impact player, so what gives?
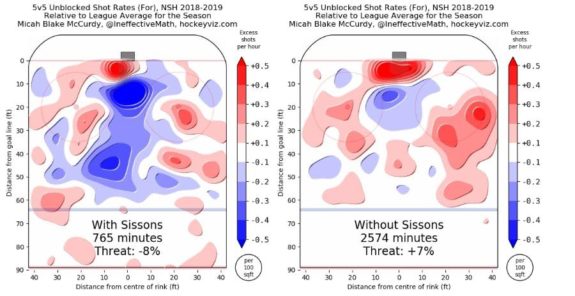
For starters, it’s the result of his on-ice linemates. Looking at the threat levels of the players he’s deployed the most with – Bonino, Watson and Järnkrok – reveals that Sissons’ impact on the team is much bigger than the others’ impacts.
For example, with Bonino on the ice, the Predators’ threat level is minus-12 percent, and without him, it’s plus-nine percent. With Watson, it’s even worse at minus-14 percent and plus-six percent without him, while Järnkrok is slightly better with a minus-10 percent with him deployed and a plus-eight percent when he isn’t on the ice.
Because Sissons generally plays third and fourth-line minutes and starts in the defensive zone a majority of the time, his ability to generate offense is hindered. Couple that with often playing with linemates not known for their offensive skillsets and it makes sense why the Predators have a negative threat level when he’s on the ice.
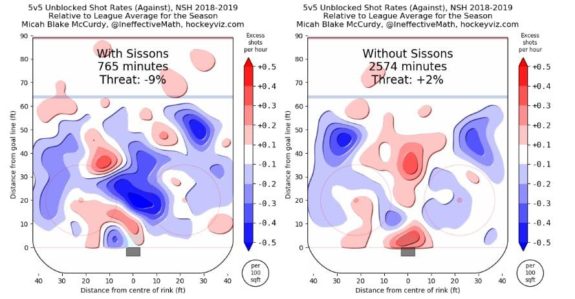
When looking at five-on-five shots allowed, Sissons’ positive impact is revealed. When he’s on the ice, Predators’ opponents are a minus-nine percent threat. However, when he’s not deployed, the threat level increases to plus-two percent.
On the power play, an area in which the Predators have struggled this season, Sissons has also been a positive impact, even if it hasn’t led to goals. With him on the ice, the Predators are a minus-17 percent threat, still terrible, but better than the minus-18 percent threat they are when he’s not on the ice. However, his impact is truly felt while shorthanded where Predators’ opponents are a minus-13 percent threat when Sissons isn’t on the ice but a minus-15 percent threat when he is deployed.
Most Valuable Predator
The stats and metrics listed thus far in the article do a good job conveying Sissons’ production and ability to impact the game, but none convey what makes him valuable. To understand that, I’m bringing up three metrics – goals above replacement (GAR), wins above replacement (WAR) and cost-per-point. The first two measure the number of goals and wins, respectively, that a player is worth relative to a replacement-level player. Cost-per-point divides a player’s cap hit by the number of points he contributes in a season. The lower a player’s cost-per-point, the more valuable he is. First up, goals above replacement.
In 2018-19, Sissons has a GAR of 8.6, which leads Predators forwards and he has a lead of 0.2 over Bonino in second place. Sissons’ GAR is comprised of 7.5 at even strength (second-highest on the team), 0.5 on the power play (second-highest) and 0.3 on the penalty kill (fourth-highest). His 8.6 GAR is also a career high, having surpassed the 5.8 he accumulated in 2015-16.
Also this season, he has 1.5 WAR. He is tied with Bonino for the team-lead among forwards and they are 0.3 ahead of Smith in third place. Again, Sissons’ WAR is a career high, having surpassed the 1.1 he totaled in 2015-16. Not bad for a player who’s largely been a bottom-six forward this season.
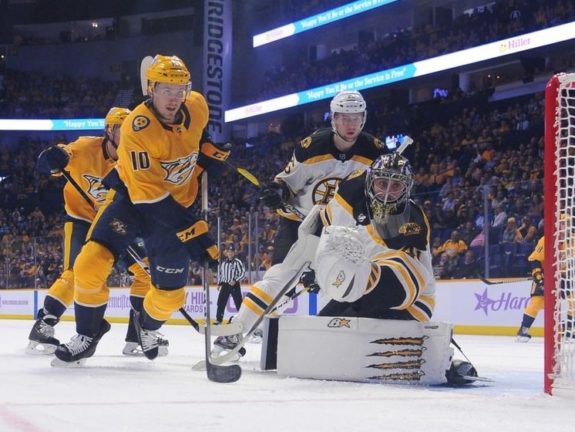
The last value category, cost-per-point, also bodes well for Sissons. With his $625,000 cap hit, his cost-per-point is $25,000 for 2018-19, the lowest among all Predators and tied for 28th-lowest in the league. His cost-per-point is half of Grimaldi’s $50,000 in second place. Sissons has had a low cost-per-point throughout his career, including $23,148 last season and $62,500 in 2015-16. However, because he’s a restricted free agent this offseason and due a raise, his cost-per-point likely won’t be as low in 2019-20.
2019 Playoffs & Beyond
Sissons doing so much for the Predators with modest playing time while also having the team’s lowest cap hit makes him a valuable asset. Factor in that he leads or is tied for the team-lead in GAR and WAR and he’s the most valuable Predator this season. That doesn’t mean he will out-produce Arvidsson, Forsberg or Johansen, but it does mean that he provides the most with what he is given, both in terms of salary and usage.
For the Predators to go deep in the 2019 Playoffs, they need Sissons to continue producing. Perhaps that will occur in an elevated role on the second line, bumping down a lesser-productive player like Turris. If that is the case, Sissons should have a middle-six role carved out for the foreseeable future, hopefully on a long-term deal he signs this summer.
*All stats come from Hockey-Reference, Natural Stat Trick, HockeyViz and Evolving-Hockey