For part 2 in this series, see Plus-Minus Revisited, the Results: Part 2 of 2.
Plus-minus (PM), or the number of goals your team scored while you were on the ice minus the number of goals the other team scored while you were on the ice, is an interesting stat. It is regularly cited with player profiles, yet receives much derision from NHL stat gurus, even as it spreads to other leagues. A PM of zero implies, to a casual fan, that the player is average, not poor, but not excellent. Beyond that, positive is good and negative is bad. But is a player with a PM of +3 better than the average (median) player, or is it just an average player who had a bit of luck?
PM is an elegant stat, designed to draw attention to deserving players who aren’t goal scorers, and to remind us that sometimes scoring machines do so by taking significant defensive risks. But it has well known problems. Not every player is put on the ice in the same situation. Some players have the role of warding off offensive heavy hitters – regularly taking shifts that start in the defensive zone and heading to the bench once the puck is safely on the other side. These players’ efforts are harder to quantify with any of the simple stats that have been so prevalent for so long. Also special teams specialists take an unfair hit; while the rare short-handed goal counts towards PM, a regular power play goal doesn’t. Other players are paired up with weaker teammates to balance lines, and so they all take the hit of a goal on their PM stat together. Sentiments on the statistic vary from calling it “deceiving”, to “the worst statistic in hockey” (I am sure I can think of worse), to “horse-[manure]”. I don’t disagree with any of the arguments discussed. Yet, the names that top the all-time PM lists, such as Bobby Orr, Wayne Gretzky, and Larry Robinson, are exactly who should be there; PM must have some redeeming qualities as a statistic.

There have been numerous efforts to correct some of these problems, but I am looking at this in a different way. It is based, in part, in time a player has played. For example, a PM of +40 is impressive,… if it is over one season (enough to be the PM leader 7 of the last 8 years), but over a career it is entirely underwhelming. But what about a player pulling in +8 on the season, or -5? Is he better than average? Worse?
Random Walk
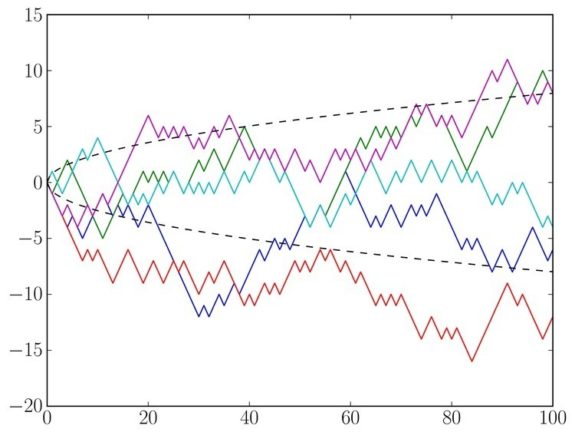
A random walk is an oft studied mathematical scenario. Imagine playing a coin game with a friend, you flip a coin, she calls it in the air, and the winner gets a one penny from the loser. You repeat this many times. Since this is a perfectly balanced situation, on average you would expect to be even, to have a PM of zero. But how likely is it that you are 8 cents up or 5 cents down? On average, you will stray from breaking even (in either direction) by the square root of the number of times the game is played, times the square root of (2 / pi) (just because math can’t ever be obvious). That is, after one hundred plays you are likely to be about 8 cents off what you started with – either up 8 or down 8.

In the same way, a totally average NHL player is most likely to have a PM of zero, since a goal scored when he is on the ice is equally likely to be for his team as it is against. But, just as with the coin game, a non-zero PM is also “quite” likely. To determine how much variation should be expected, let’s look at the league average scoring rates for this last regular season. The league average goals per game per team is 2.66 in the 2014-2015 regular season. Since power play goals don’t count, we subtract the 0.57 power play goals per game per team to get 2.09 goals per game per team contributing to PM. That means that for every sixty minutes of ice time, a player will be on the ice for 4.18 goals scored. For example, Detroit Red Wings defenseman Drew Miller has a PM of -3 this recent regular season – a stat that suggests that he is below average. But over his 1100 minutes of time on ice (TOI), 77 goals, on average, should have been scored. So if Miller is an average player, we would expect him to have a PM in the range of -7 to +7 considering how much he played this season. That is, a PM of -3 is entirely consistent with him being an average NHL player, and isn’t strong enough to convince anyone that he is a sub-par player.
A bit more formally, we can write the expected range of an average NHL player as the square root of (2 / pi) x 4.18 x TOI / 60 minutes, or 0.211 times the square root of a players’ TOI in minutes. This formula scales properly with TOI for one game or many.
Scaled Plus-Minus
In fact, this leads us to the natural introduction of a new statistic, I will call “scaled plus-minus” or SPM. Take a players’ regular PM statistic, and divide it by that expected based on his TOI: SPM = PM / (0.211 x sqrt(TOI)). So Drew Miller’s SPM would be -0.43. Any SPM between -1 and +1 should be thought of as generally consistent with the performance of an average player on the ice.
In fact, this new PM stat can be quantified even more precisely. Running some quick Monte-Carlo simulations, I see that 51% of average players are likely to have SPM’s in the range -1 to +1. So players with SPM outside of this range are more likely to be either better than average or worse than average, than actually average. Furthering this, 90% of average players should have an SPM in the -2 to +2 range. So a player with SPM more than +2 (or less than -2) is almost certainly an exceptional (or disappointing) player, within the context of the PM statistic.
Continue reading on the consequences of this new statistic in part 2 in this series: Plus-Minus Revisited, the Results: Part 2 of 2.
Caveats, Fine Print
SPM does not account for the fact that not all shifts are the same, a problem inherent in PM. I also make a reference to “players on the ice” instead of “players in the league,” poor players tend to not last as long skewing the mean towards better stats. If the mean is taken weighted by time on ice, then “players on the ice” and “players in the league” is the same thing. The 4.18 number for average goals scored in a game that contribute to PM, changes historically. As with all statistics, applying them in a small sample size situation (after, say, one game) is a dangerous thing to do. All the best players had single games with negative stats. A PM of -1 over 15 minutes TOI yields an SPM of -1.22, similarly a hat trick over the same amount of time yields the massive +3.67. Over time SPM should approach a constant: the player’s true value, unlike PM.