Perhaps not:
Let’s start over: “A player’s shooting percentage in a given season has more to do with his luck as a shooter than his skill or the way he’s actually playing.”
How about an entire team’s shooting percentage? The supposedly fairly-skilled Los Angeles Kings seem to be suffering through such an “unlucky” season, as they’re second to last in the league in both total and 5-on-5 shooting percentages (7.4% and 6.2% as of 3/20/14). How will such abysmal regular season numbers affect Los Angeles’s chances at a Stanley Cup?
Of course, just two regular seasons ago, a LA squad that finished dead last in both total and 5-on-5 shooting percentages came alive—or more exactly, “regress[ed] to the mean”—in the playoffs. Can we expect such a revival this Spring?
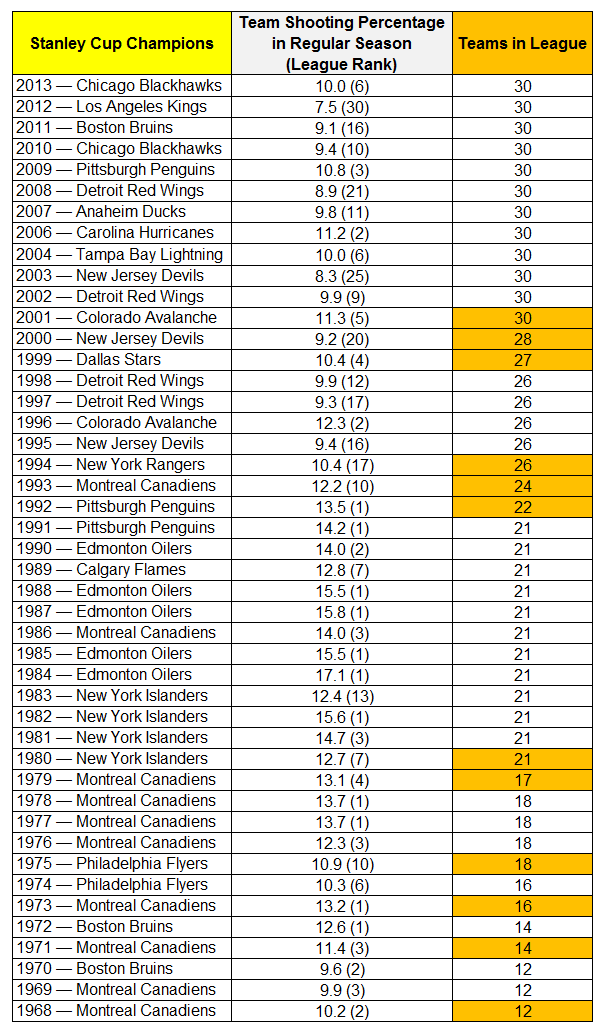
Thanks to sportingcharts.com and hockeyreference.com, here’s a list featuring every Stanley Cup winner since 1967-68 (no shooting percentage data could be found before then), along with their regular season team shooting percentage and league ranking.
Team Shooting Percentage (Regular Season), Stanley Cup Winners (1968-2013)
 Two things popped out as I was sorting this data. First, the 2012 Kings run was completely unprecedented; only the 2003 New Jersey Devils betrayed a similar, bottom-feeder ranking, and even they were over a full percent point better than last place. However, in a related point, championship teams have been routinely shooting less successfully (compared to their peers) in the regular season since the early ’90s.
1992-93 becomes a sort of demarcation point for this trend.
As for why? Perhaps one can look toward overexpansion? The NHL went from 22 to 24 teams in 1992-93. Hence, was league-wide shooting talent being diluted? However, the influx of skilled European players into the league was building in that period of time. So instead of dilution, was the talent pool actually deeper with this infusion of foreign players? More talent was distributed more evenly among an ever-increasing number of teams; these more equally powerful teams, no pun intended, were “checking” each other’s shooting success.
Or maybe, it’s as simple as different goaltending styles and larger equipment? You can also consider 1994-95, as leaguewide scoring (5.97 Total Goals per Game) dipped to its lowest level since 1969-70 (5.81 Total Goals per Game); Total Goals per Game have stayed around there since then (compare to 1981-82’s 8.025 Total Goals per Game).
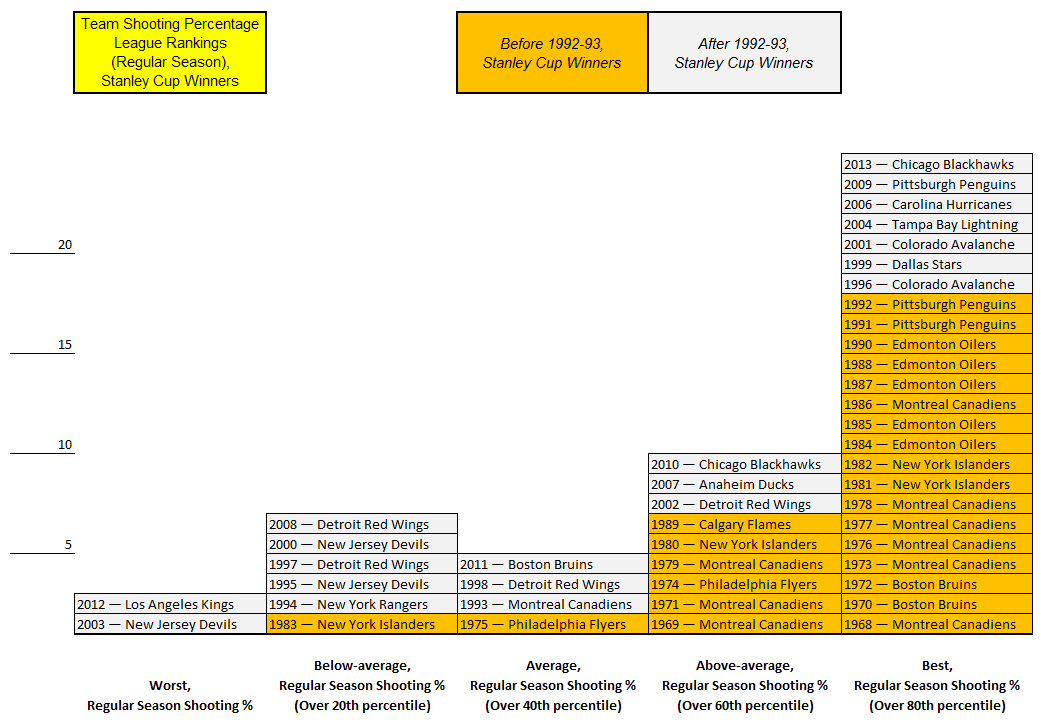
Team Shooting Percentage Relative (Regular Season), Stanley Cup Winners (1968-2013)
But I digress. To get a closer look at this ’90s team shooting percentage trend, here’s a graph featuring every Stanley Cup winner since 1967-68 and their regular season team shooting percentage within the context of the rest of the league. To address the ever-growing number of teams since expansion, Best in team shooting percentage is ranking over the 80th percentile of the league, Above-average is over the 60th percentile, Average is over the 40th percentile, Below-average is over the 20th percentile, and Worst is under that.
Here, we see that 24 of the last 45 championship teams were among the league’s Best in regular team shooting percentage; nine were Above-average; four were Average; six were Below-average; and two were Worst. But since the 1993 Montreal Canadiens, distribution is far more balanced: Seven teams have been among the League’s Best; three have been Above-average; three have been Average; five have been Below-average; and two have been Worst.
As for this year’s Kings, if you’re optimistic, you believe Dustin Brown’s 7.4 regular season shooting percentage (11.6 from 2010-13), Mike Richards’s ridiculous 6.4 (12.6 from 2007-13), and Slava Voynov’s 2.5 (8.5 from 2011-13) will benefit from greater luck sooner than later. The good news is none of the team’s top scorers are enjoying unusually strong shooting campaigns. The bad news? We’re talking about the same problem that we were talking about two years ago. What are the chances LA rope-a-dopes the whole league once again?
