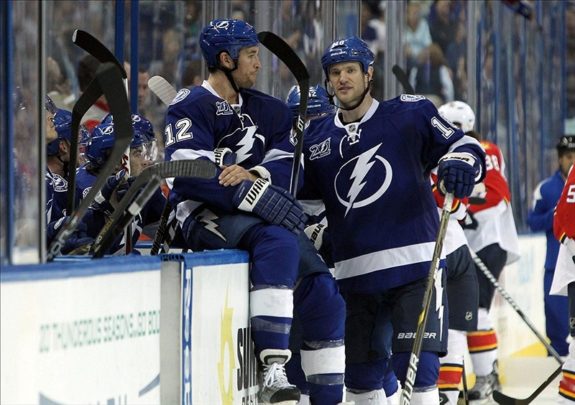
It has been well noted that the Tampa Bay Lightning, while having elite offensive talent, have issues keeping the puck out of their own net. In my last article I examined the amount of quality starts the Lightning received from their goalies. That number being 48.9% of their games played.
But what quality of players are the Tampa Bay Lightning goalies playing behind? Surely you cannot fall into the trap of blaming the goalies solely for the holes in the Lightning’s game.
Let’s take a look at the numbers.
Lightning Strikes
While Tampa Bay was fourth in the NHL with 3.06 goals per game, they also finished 26th with 3.02 goals against per game. Are they allowing too many shots per game?
They finished in the bottom half of the league they finished 20th overall with 30.2 shots allowed per game. To compare, the New Jersey Devils were first overall at 23.2 and the Buffalo Sabres were last overall at 33.5.
How well did they play at even strength (5 vs. 5)? They finished ninth overall scoring 1.09 goals for to every goal against.
How about their record in one goal games? They showed an inability to lock down defensively with a 0.238 winning percentage in one goal games. This equates to a record of 5 wins, 12 losses and 4 overtime/shootout losses. This record ranked them last (30th overall) in the NHL.
I believe this is a telling sign that this team as currently constructed is not defensively sound.
http://youtu.be/lgU16tGBlDg
Quality of Defensive Players
It is clear when you look into the Corsi statistics that the Tampa Bay Lightning goalies were at a great disadvantage when it came to the quality of teammates playing in front of them.
Corsi HARD QOT (5 vs. 5) is a stat that measures the average quality of defensive teammates on the ice when the goaltender is playing.
Ben Bishop has been the luckiest of the bunch with a -8.5, Cedrick Desjardins saw -15.3 Mathieu Garon was treated to -16.6 and Anders Lindback was worked the hardest at -16.9 quality of defensive teammates.
Corsi HARD QOC (5 vs. 5) measures the average quality of the opponents offensive players while the goaltender is on the ice.
Once again Ben Bishop was the lucky one with 4.21, then Matheiu Garon with 5.25, Anders Lindback with 5.55 and Cedrick Desjardins was hung out to dry with 9.26.
A League-Wide Comparison
In terms of quality of teammates on the ice, Martin Brodeur and Johan Hedberg of the Devils led the league at 36.5 and 36.0 respectively.
At the other end of the scale the Toronto Maple Leafs tandem of James Reimer and Ben Scrivens were saddled with -57.9 and -58.7 respectively.
Where did the Lightning goalies fall (out of 71 goaltenders)? Ben Bishop was 46th in the NHL. While Cedrick Desjardins, Mathieu Garon and Anders Lindback ranked 56th, 57th and 58th in the NHL.
In terms of quality of offensive opponents Rick DiPietro was the highest at 13.04 while the lowest was Chad Johnson at -6.71. While James Reimer ranked 4th with 7.91 and Roberto Luongo ranked 70th with -6.55.
So where did the Lightning goalies end up? Cedrick Desjardins was 2nd, Anders Lindback 15th, Mathieu Garon 20th and Ben Bishop was 33rd.
Another telling stat is the percentage of where the faceoffs were located for the Tampa Bay Lightning. They had 28.7% (28th) in the offensive zone, 39.4% (3rd) in the neutral zone and 32% (14th) in the defensive zone.
Clearly the Lighting spent most of their time on their half of the ice. The Bolts goaltenders had much less time than most to take a breath and not be in the thick of things.
The Main Idea
In analyzing the numbers it is very telling that the Tampa Bay Lightning goalies faced more shots than most, had the play on their side of the ice more than most, and had lower quality of defensive players than most in front of them.
Essentially the goalies, while only providing 48.9% quality starts are clearly in need of more help from their teammates. This is an area general manager Steve Yzerman will be looking to improve via free agency or trade this offseason.